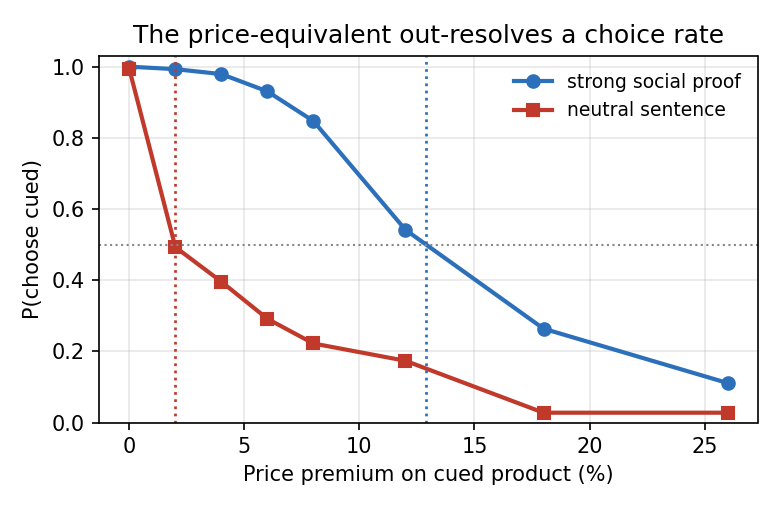
Seller cues—“authority,” scarcity, social proof—on a product page can steer AI shoppers. At equal price, six cues each win ≥95% of trials and look identical; raising the cued item’s price until choice returns to 50/50 yields price-equivalents from about 1.6% to 21.4%. The authors treat that price-equivalent (PE) as an audit scale, with matched products, position counterbalancing, and an eight-level 0–26% premium sweep. Equal-price win rates glue strong and weak cues together; willingness to pay separates them.
1. Problem: win rate does not price a cue
Shopping-agent work already shows titles, images, order, and copy move choices, but most metrics are equal-price win or completion rates. Strong cues saturate near 100% and become indistinguishable; first-option bias averages near 50% after counterbalancing and looks like indifference. The authors want a shared scale: how many percent of price does a cue equal before the agent ties the control item.
2. Method: price-equivalent audits on matched pairs
Each trial is a binary choice: one side carries the cue, the other does not; the cued side’s price rises through 0, 2, 4, 6, 8, 12, 18, 26% (dense near 0; 26% is an empirical ceiling). Matched pairs (e.g., coffee machines, six pairs per category) swap left/right to cancel primacy. PE is the premium where choice hits 50%; out-of-window crossings are right-censored lower bounds. 95% CIs use a product-pair bootstrap. A cue-free price-sensitivity curve is reported alongside, so PE is read as a cue–price profile rather than a single cross-model score.
3. Core claim: cue strength as equivalent markup
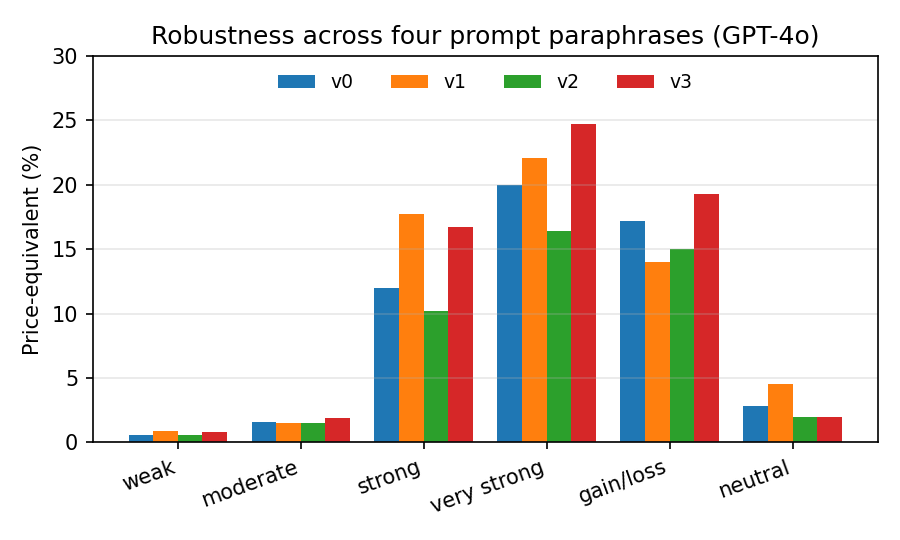
Six cues all clear ≥95% at zero premium and cannot be ranked by win rate; PE spreads them to roughly 1.6%–21.4%, and equal-price rank can invert PE rank. Audit “how much markup is this cue worth,” not only “did it win.”
4. Experiments
Multiple frontier chat models (including GPT-4o; some smaller models dropped for instability). Cue sentences cover classic influence channels; full lists sit in the appendix. Strong-cue crossings often fall near 13–22% premium. Related framing effects (e.g., admit vs reject prompts moving admission from 37.5% to 78.0%) motivate treating steerability as common; this paper puts price in the same trial instead of stitching separate cue and price runs.
| Metric | Observation |
|---|---|
| Zero-premium win rate | ≥95% for six cues |
| PE range | ~1.6%–21.4% |
| Premium grid | 0–26%, 8 levels |
| Typical crossing band | ~13–22% |
5. Limits
PE must be read with price sensitivity; 26% is empirical, not theoretical; categories are limited; agents are not claimed to be human shoppers.
6. Practice
Add a price sweep to AI shopping evals and report PE. Platforms can threshold seller copy by equivalent markup instead of waiting for saturated win rates.