Hybrid retrieval fuses the results of term-matching sparse retrieval such as BM25 with those of dense vector retrieval into a single ranking. The documentation of Elasticsearch, Azure AI Search and LangChain all list reciprocal rank fusion (RRF) as the recommended or only fusion method, on the basis of gains in average metrics. This paper keeps the books differently: it compares nDCG@10 before and after fusion query by query, and treats "no fusion" as a legitimate option. The authors test on 7 BEIR datasets with standard Anserini BM25 and the BGE-small dense model. The best fusion method is score interpolation with a 0.7 weight on the dense score, which beats dense-only retrieval in mean nDCG@10 on every dataset, by 0.008 to 0.051; yet in the same setting 8–21% of queries rank worse than with dense-only retrieval, and 13–48% rank worse than the better of the two retrievers on that query. The authors call this per-query loss the "fusion tax". The losses concentrate on queries where only one retriever finds a relevant document, and the other retriever then contributes only noise. Switching to a larger dense encoder, replacing BM25 with SPLADE, or adding a cross-encoder reranker after fusion does not make this tax disappear.
1. The average went up, so why look query by query
A higher mean nDCG@10 only says that more queries were helped than hurt; it does not say that no query was hurt. For a RAG system the difference has practical consequences: if fusion pushes a query's relevant document out of the top 10, the context given to the generator no longer contains the answer, and the answer quality for that query drops directly, while the average does not show it.
The authors therefore keep two accounts for every query. The first uses the "per-query best" as reference: whichever of BM25 and dense retrieval does better on a given query is compared with the fused result. This reference is only known after the fact and measures whether fusion drags down the better retriever. The second uses "always dense-only" as reference, an alternative that can actually be deployed, and answers whether adding BM25 is worth it at all.
2. The accounting: one formula, four quadrants
The fusion tax of a single query is defined as the nDCG@10 of the better of the two retrievers minus the nDCG@10 after fusion:
Here is sparse retrieval (BM25), is dense retrieval and is the fused result. means fusion is worse than the better retriever on that query. The share of queries with is called the "oracle tax"; the share of queries where fusion falls below dense-only retrieval is called the "deployable tax".
Three fusion methods are compared. RRF sums the reciprocals of the ranks, with the constant set to 60. Score interpolation first min-max normalizes the scores of each retriever's top 100, then adds them as with . CombMNZ sums the normalized scores and multiplies by the number of retrievers that returned the document.
To find where the losses come from, the authors split queries into four quadrants by whether each retriever puts at least one relevant document in its top 10: both retrievers hit (Both-Win), only dense retrieval hits (Dense-Only), only BM25 hits (Sparse-Only), and neither hits (Both-Fail).
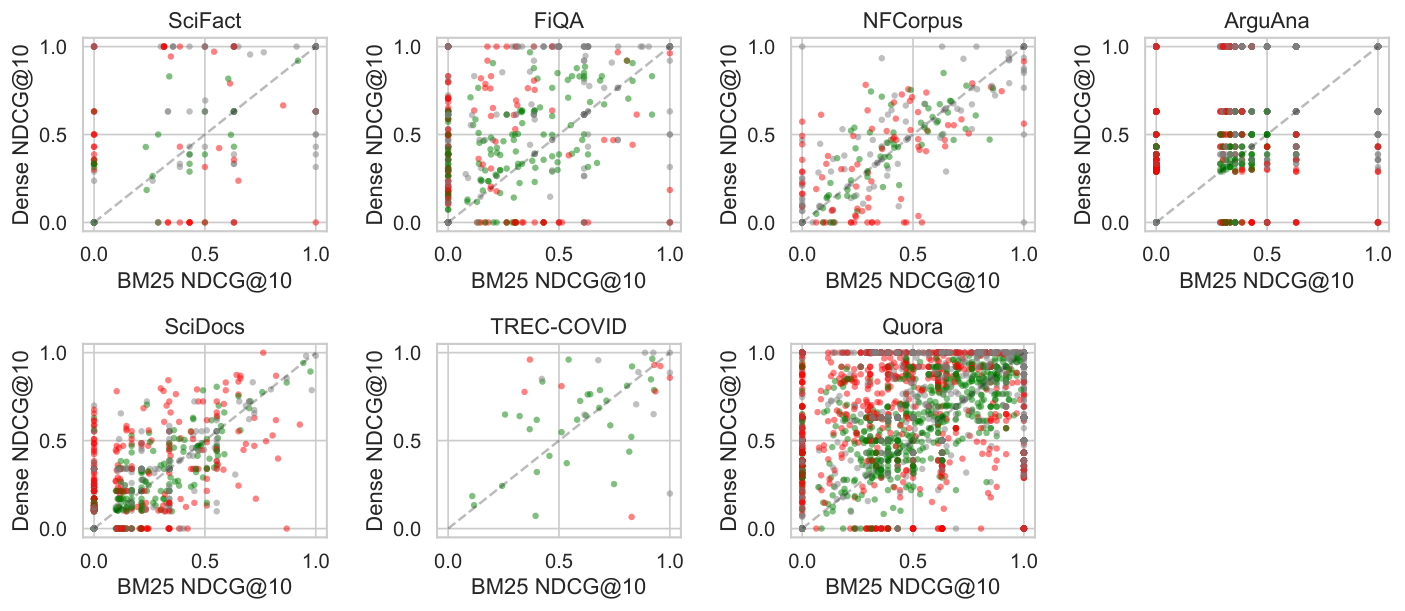
The sparse side uses BM25 with Anserini default parameters (k1=0.9, b=0.4, title and body indexed as separate fields), which the authors confirm reproduces the published BEIR results to 4 decimal places; this rules out the explanation that "BM25 drags fusion down because it was badly tuned". The main experiments use BGE-small (33M parameters) on the dense side, with MiniLM (22M), BGE-base (110M), BGE-large (335M) and Qwen3-Embedding-0.6B (596M) as alternatives, all searched exactly with FAISS. The 7 datasets are SciFact (scientific claim verification), FiQA (financial QA), NFCorpus (medical nutrition retrieval), TREC-COVID (COVID literature retrieval), ArguAna (finding counter-arguments), SciDocs (citation recommendation) and Quora (duplicate question retrieval), with query counts ranging from 50 for TREC-COVID to 10,000 for Quora.
3. Experiments
3.1 Averages: interpolation does win
This experiment first checks whether fusion is as effective on average metrics as is usually claimed. The authors compare nDCG@10 of each retriever alone and of the three fusion methods with BGE-small on the 7 datasets (paper Table V):
| Dataset | BM25 | Dense-only | RRF | Interpolation α=0.7 | CombMNZ |
|---|---|---|---|---|---|
| SciFact | 0.6647 | 0.7200 | 0.7152 | 0.7307 | 0.7230 |
| FiQA | 0.2361 | 0.3848 | 0.3667 | 0.4087 | 0.3872 |
| NFCorpus | 0.3254 | 0.3371 | 0.3570 | 0.3547 | 0.3574 |
| ArguAna | 0.4142 | 0.5950 | 0.5549 | 0.6027 | 0.5702 |
| SciDocs | 0.1581 | 0.1973 | 0.1954 | 0.2070 | 0.1976 |
| TREC-COVID | 0.6559 | 0.6660 | 0.8010 | 0.7166 | 0.8045 |
| Quora | 0.7886 | 0.8878 | 0.8695 | 0.8997 | 0.8857 |
Score interpolation beats dense-only retrieval on all 7 datasets. RRF beats dense-only retrieval only on NFCorpus and TREC-COVID, where BM25 and dense retrieval are at similar levels (0.656 vs 0.666 on TREC-COVID); on the other 5 datasets RRF is below dense-only retrieval. RRF looks only at ranks and not at scores, so even when dense retrieval is clearly stronger it treats BM25's ranks as equally trustworthy, which dilutes the dense side's advantage.
3.2 Per-query accounts: how many queries get worse behind the higher average
This experiment checks how many queries are hurt, and how badly, while the average rises. The authors compare interpolation and RRF query by query against dense-only retrieval and against the per-query best (paper Table VIII):
| Dataset | Interp. worse than dense | Mean loss when worse | Interp. better than dense | Mean net change | Interp. below per-query best | RRF worse than dense |
|---|---|---|---|---|---|---|
| SciFact | 10.0% | 0.205 | 14.7% | +0.0107 | 20.0% | 15.3% |
| FiQA | 14.7% | 0.100 | 23.1% | +0.0239 | 23.3% | 30.4% |
| NFCorpus | 18.3% | 0.044 | 33.4% | +0.0177 | 39.0% | 23.8% |
| ArguAna | 19.1% | 0.213 | 21.8% | +0.0077 | 30.4% | 32.9% |
| SciDocs | 20.9% | 0.070 | 26.1% | +0.0097 | 36.2% | 27.6% |
| TREC-COVID | 14.0% | 0.054 | 72.0% | +0.0506 | 48.0% | 26.0% |
| Quora | 8.2% | 0.167 | 12.4% | +0.0119 | 12.8% | 16.2% |
Take ArguAna: interpolation makes 19.1% of queries worse, the worsened queries drop by 0.213 on average, almost as much as the 0.221 average gain of the improved queries, and the mean net change is only +0.0077. The small rise in the average is the difference left after large gains and large losses across many queries cancel out.
One might suspect that the 0.7 weight was picked on the test data. The authors re-select the weight with leave-one-dataset-out cross-validation: choose on the other 6 datasets and apply it to the 7th. The resulting deployable tax is 11–25%, slightly higher than with a fixed 0.7, which shows the tax is not caused by tuning on the test set. The risk-sensitive test TRisk, which weights the losses of worsened queries more heavily, judges interpolation riskier than dense-only retrieval on 6 of the 7 datasets.
3.3 Which quadrant the losses come from
This experiment checks which kind of query the losses come from. The authors split interpolation's per-query gains and losses by the four quadrants of Section 2 (paper Table VII). Result: Sparse-Only queries make up no more than 7% of the total, but 87–95% of them are hurt by fusion, with mean net losses of 0.14 to 0.37 within the quadrant. The reason is that dense retrieval has no relevant document in its top 10 on these queries, and the 0.7 dense weight pushes down the relevant documents BM25 found. Dense-Only queries are the mirror case: BM25 becomes the noise source and 38–65% are hurt. Among Both-Win queries, 10–48% are reordered, with help and harm nearly cancelling and a quadrant net change between −0.04 and +0.01; because this quadrant holds the most queries, it contributes 38–72% of the worsened queries.
The losses are mainly rank changes, not lost relevant documents: queries whose top-10 recall drops are only 1–7%, and most of the loss is relevant documents moving down within the top 10; across all datasets, 77 queries have all their relevant documents pushed out of the top 10.
3.4 A bigger encoder does not remove the tax
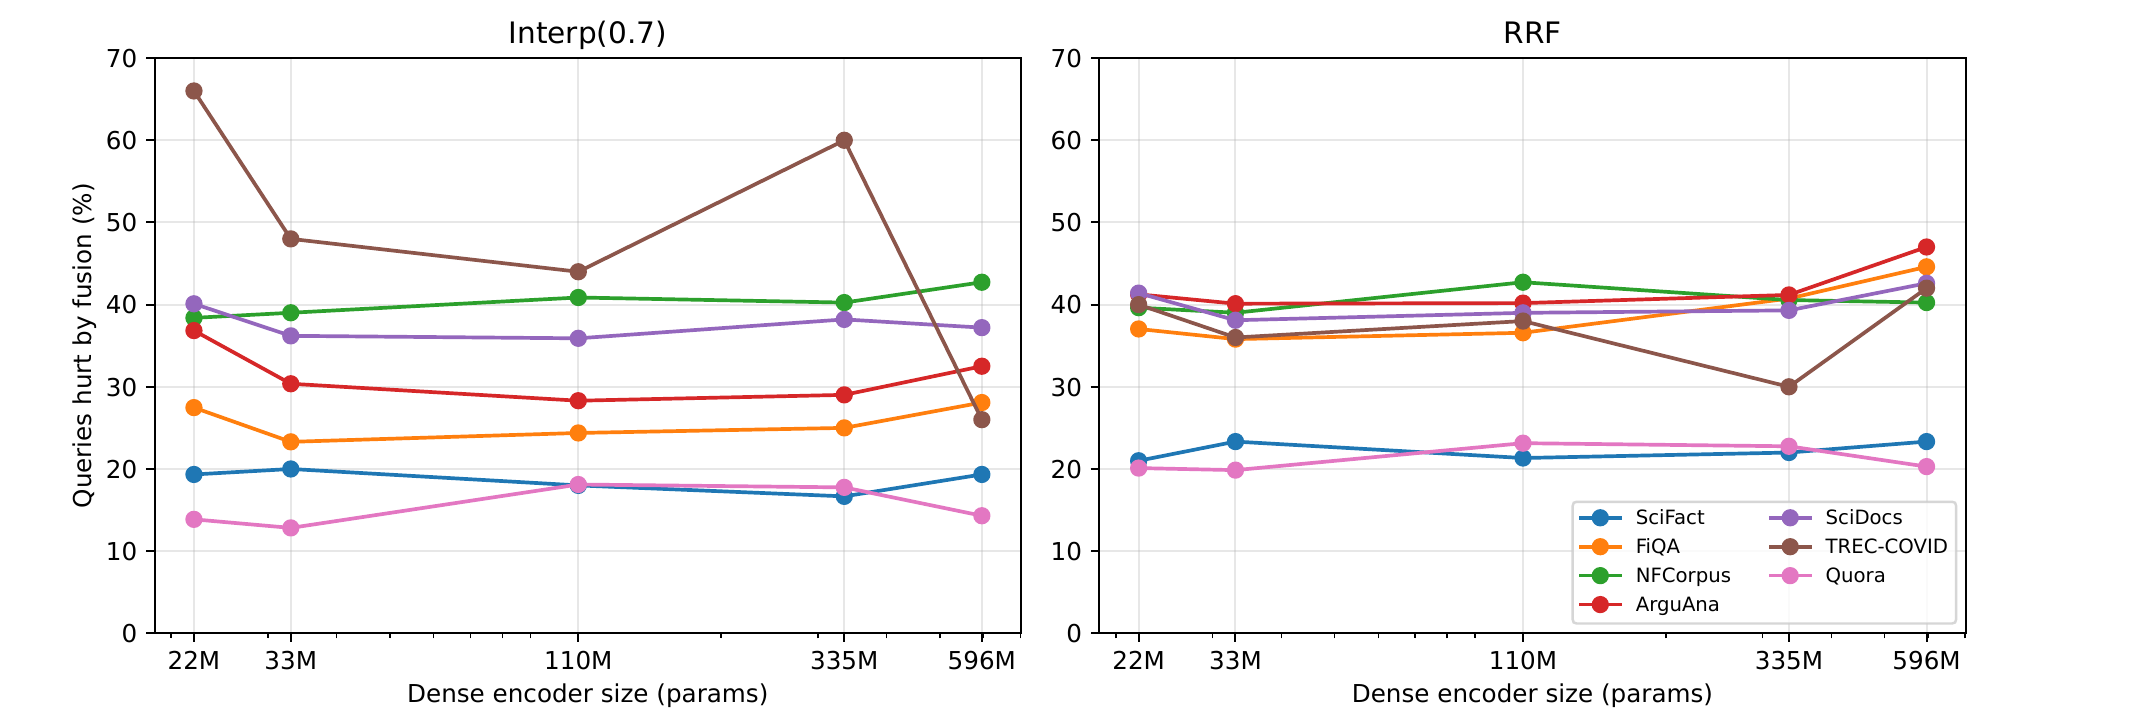
This experiment checks whether the fusion tax exists only because the dense model is weak. The authors step the dense encoder up from 22M to 596M, then redo the experiment with BM25 replaced by the learned sparse retriever SPLADE. Result: with Qwen3-Embedding-0.6B, interpolation still puts 14–43% of queries below the per-query best; with SPLADE it is 14–41% on 6 datasets and 60% on TREC-COVID. A stronger encoder only changes the balance between the two retrievers, and that balance decides which retriever becomes noise on each query, so the share of hurt queries does not decline as the encoder grows.
3.5 Can we tell in advance which queries should not be fused
If this could be predicted, queries could be routed: fuse where fusion helps and use dense-only retrieval elsewhere. This experiment checks whether that is feasible. The authors extract 17 features available at inference time for each query (query length, IDF statistics of its terms, the score gap between the first and second result of each retriever, the overlap of the two top-10 lists, and so on) and train gradient-boosted trees to predict whether fusion will fail. Result: AUC is 0.63 within a dataset, falls to 0.59 across datasets, and is as low as 0.49, close to random; 11 of the 17 features flip the direction of their association with failure across datasets. A router built on these features does not beat fixed interpolation on any dataset. A concrete example is the dense side's score lead: on datasets where dense retrieval is stronger it signals that fusion is safe, but on TREC-COVID it signals that fusion will fail.
3.6 Can reranking repair the damage
This experiment checks whether a cross-encoder reranker after fusion can repair the losses fusion causes. The authors rerank the top 30 with BGE-reranker-v2-m3. Result: the deployable tax falls by a third on SciFact and does not fall on FiQA or TREC-COVID. Reranking both repairs losses and creates new ones: on SciFact it repairs 27 of the 30 previously hurt queries and newly hurts 17; on FiQA it repairs 75 of 95 and newly hurts 81; on TREC-COVID it repairs 5 of 7 and newly hurts 9. After reranking, nDCG@10 differs by at most 0.011 whether the candidates come from interpolation or from dense-only retrieval. On cost, BM25 takes 1.1–4.3 ms per query on an Apple M5, while cross-encoder reranking of 30 candidates takes about 1.6 s.
4. Limitations
The authors list five limitations: only retrieval ranking is evaluated, not the final answer generation; only one reranker and one reranking depth are tried; TREC-COVID has only 50 queries, so its percentages fluctuate a lot; latency is measured on one machine only; and the prediction experiment uses only cheap features, without trying LLM judgments.
Two further points deserve attention. First, all 7 datasets are English BEIR datasets whose queries are mostly natural-language questions, and dense retrieval is stronger than BM25 on all 7 of them; in keyword-heavy settings such as e-commerce or code search, Sparse-Only queries may be far more than 7%, and both the quadrant shares and the recommended weight need to be re-measured. Second, Section 3.3 shows that most of the loss is relevant documents moving down within the top 10; if the downstream system feeds all 10 documents into the generator's context, this loss affects the answer much less, which is exactly the gap left by not evaluating generation.
5. Practical implications
First, before adopting hybrid retrieval, measure the nDCG@10 of each retriever on the target corpus. The authors' rule is: if dense retrieval leads by more than 0.04, use score interpolation with a dense weight of 0.6–0.7; if the two are close, use RRF, CombMNZ or interpolation with weight 0.5. Labeling 200–400 queries is enough to make this call, and transferring the 0.6–0.7 weight to another dataset costs at most 0.014.
Second, in online evaluation, report "the share of queries worse than dense-only retrieval" and "the mean loss when worse" alongside the average. These two numbers show directly whether a higher average comes from most queries gaining a little, or from some queries gaining a lot and cancelling out large losses on others.