Contents · 9 sections
1What problem is it actually solving?2Overall structure: one model, four heads, one scoring formula3The ordinal relevance head: why predict "at least grade k"4The unified scoring formula: how the weights work5Where the labels come from: 600k human labels scaled to 100 million6Experiments: offline, the trade-off curve and online7Limitations as I see them8How a search team could try it9VerdictSHARE

E-commerce search ranking teams troubleshooting "high-click but off-topic" results should read this paper: it offers an approach with very low deployment cost, backed by a positive three-week A/B test. The core idea in one line: use a fine-tuned small LLM to label over 100 million query-item pairs offline with three relevance grades, add an "at least grade k" ordinal relevance head to the existing multi-task ranking model, and combine it with click, add-to-cart and conversion predictions into one weighted total score. Offline relevance NDCG@10 rises from 0.812 with behavioral signals only to 0.962, while click, add-to-cart and conversion AUC stay essentially unchanged; in DoorDash's three-week online A/B, add-to-cart rate (ATCR) is +1.16%, CVR +1.10% and gross order value (GOV) +0.50%, all significant.
What problem is it actually solving?
Start with an illustrative scenario. A user searches "milk" in a grocery delivery app. The ranking model learns only clicks and orders, and it puts discounted chocolate-milk cookies in second place: cheap and widely clicked, but not the milk the user wants. Over time users rewrite queries, page through results, and feel the search "doesn't get them".
The paper attributes this to two causes. First, optimizing only on behavioral signals systematically lifts popular, price-anchored and lexically overlapping items. Second, reliable semantic relevance supervision is scarce: human labeling is expensive and slow, and with millions of items and many long-tail queries it cannot keep up; behavioral signals are plentiful but carry position bias, exposure bias and feedback loops.
LLMs can give relevance judgments close to human ones, but using them directly online has three obstacles: inference is too expensive and latency too high; a fine-tuned LLM classifier is sensitive to label distribution and may systematically lean toward one grade; and raw LLM scores must be calibrated before they can be ranked alongside existing behavioral objectives.
Overall structure: one model, four heads, one scoring formula
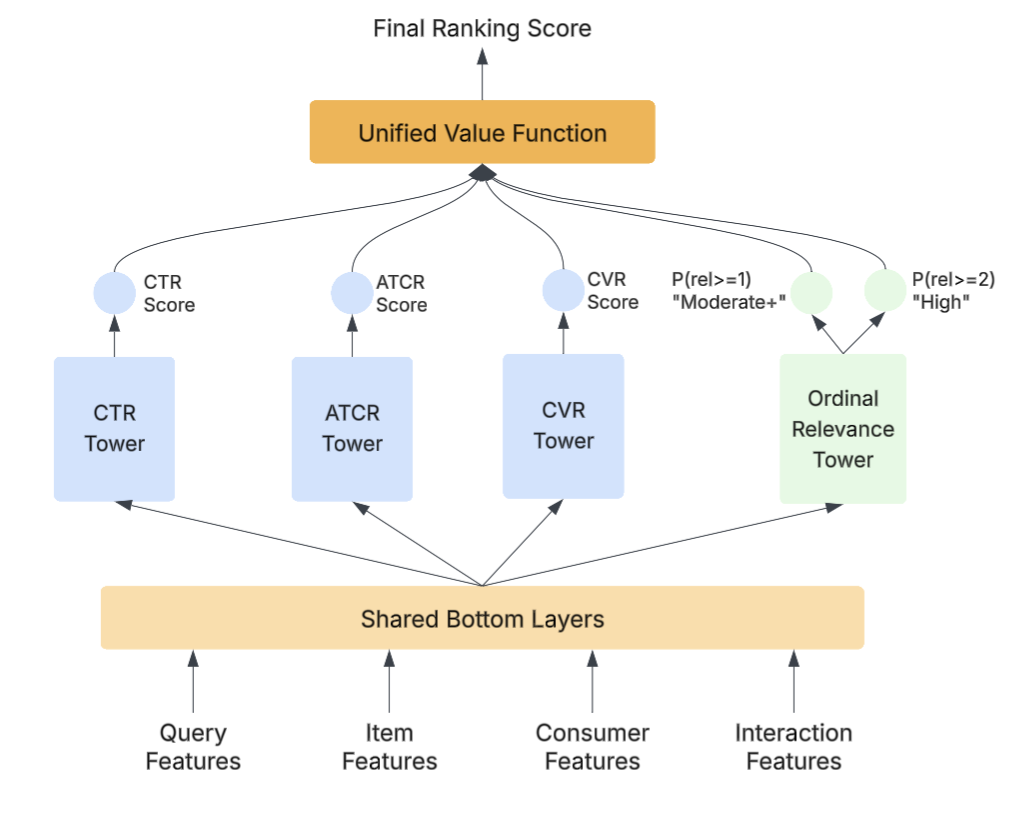
| Component | Input | What it does | Output |
|---|---|---|---|
| Shared bottom | Query features (embedding, predicted category, brand), item features (embedding, price, category, brand, historical behavior stats), user history, interaction features (BM25 over several text fields, historical query-item conversion rates, string similarity, user-item and user-category historical interactions) | Representation shared by all tasks | Shared vector |
| Three behavioral towers | Shared vector | Predict click, add-to-cart and conversion separately | , , |
| Ordinal relevance tower | Shared vector | Predicts the probability that relevance is "at least grade 1" and "at least grade 2" | Two probabilities, combined into one relevance score |
| Unified scoring | The four scores above | Weighted linear sum | Final ranking score |
The authors stress that the relevance head adds almost no compute: the main cost is large-scale embedding lookup in the shared bottom, the relevance tower uses a subset of existing features, and all four objectives are computed in one forward pass without a separate service. No LLM is called online at all; the LLM only produces labels offline.
The ordinal relevance head: why predict "at least grade k"
Relevance has three grades: 0 irrelevant, 1 moderately relevant, 2 highly relevant. The authors argue three grades express finer relations than binary labels while being easier to label than more grades; separating "relevant from irrelevant" matters for user trust, and separating "highly relevant" matters for putting the best match first when several business objectives compete.
How does it work? The relevance tower does not output a three-class softmax but two probabilities: is the probability of "at least moderately relevant", and the probability of "highly relevant". The relevance score is their sum:
This sum equals exactly the expected relevance grade, ranging from 0 to 2.
Here is an illustrative example: an item has and , so its relevance score is 1.5. Converting to the three grades: irrelevant 0.1, moderate 0.9−0.6=0.3, high 0.6; the expected grade is 0×0.1+1×0.3+2×0.6=1.5, matching the direct sum of the two probabilities.
Why better than softmax or regression? Softmax treats the three grades as unrelated classes, so "misjudging grade 2 as grade 0" is penalized the same as "misjudging it as grade 1"; regression treats grades as continuous values and assumes the distance 0→1 equals 1→2. The ordinal head keeps the "grades are ordered" structure, and its outputs are probabilities that can be thresholded directly for filtering or grouped display. The paper notes that besides entering the scoring formula, the relevance score can also be used for result filtering and UI grouping, e.g. results with below some threshold are not shown, and those with high go into a "best match" group. In the experiments the gap among the three is small, as shown later.
The unified scoring formula: how the weights work
The final ranking score is:
are all between 0 and 1, and relevance's weight is whatever remains. The authors describe only how they tuned these weights: multiple offline tests first, then several online treatments.
Here is another set of illustrative numbers (made up by me, not paper results), back to "milk": cookie A has predicted click 0.10, add-to-cart 0.04, conversion 0.02 and relevance score 0.6; plain milk B has 0.06, 0.03, 0.015 and 1.8.
- Behavior only (, relevance weight 0): A scores 0.072, B scores 0.045, A ranks first.
- Give relevance a weight of 0.1 (): A scores 0.05+0.008+0.004+0.06=0.122, B scores 0.03+0.006+0.003+0.18=0.219; because B's relevance score is 1.2 higher, B overtakes.
This shows one point: behavioral probabilities are usually a few hundredths, while the relevance score ranges from 0 to 2, so the two kinds of score differ in magnitude, and a relevance weight of 0.1 may already dominate the total. When the paper says "modest relevance weights yield substantial relevance gains", remember that "modest" is relative to these magnitudes; with a different business's click-rate levels, the right weight could be very different.
Where the labels come from: 600k human labels scaled to 100 million
Training the relevance head needs many three-grade labels. The authors follow their team's earlier process in four steps:
| Step | What it does | Purpose |
|---|---|---|
| 1. Human seed | Collect about 600k human three-grade labels for query-item pairs | Serve as ground truth |
| 2. Behavioral audit | Where the human label is 0 (irrelevant) but the item's add-to-cart and conversion rates both rank in the top 50% for that query, a larger LLM (e.g. GPT-4o, o3) re-judges it with a more detailed prompt | Find "irrelevant" labels that may be wrong |
| 3. Category reconciliation | When the human and the audit LLM disagree, consult Q2T (the team's query-to-category model, which predicts a set of relevant categories for each query): if the item's category is in the predicted set, take the higher of the two scores; otherwise take the lower | Use a third signal to settle disagreements |
| 4. Fine-tune a small model for bulk labeling | Fine-tune gpt-4o-mini on the audited human labels, then label over 100 million query-item pairs | Bring cost down enough to run on everything |
On a 105k held-out set, the fine-tuned model matches human labels exactly on the three grades 89% of the time and is within one grade 98% of the time. The authors also note fine-tuning is highly sensitive to the label distribution of the training set; they sample training data to match real production relevance proportions to keep classification stable, with the proportions themselves described only as "mimicking production".
The 9-point gap between 89% and 98% shows most errors fall between adjacent grades, and severe errors like "highly relevant judged irrelevant" are at most 2%. This suits the ordinal head well: when adjacent grades are confused, only one of the two threshold probabilities gets a skewed training target; for example, if grade 2 is labeled grade 1, the target for is still 1 and only is affected.
What stands out here is the idea in step 2: behavioral signals are not used as labels directly, only to pick out human labels worth re-checking. A high-converting sample labeled "irrelevant" is either a human error or a query with an implicit intent, and having a stronger model re-check it is safer than trusting either side outright.
Experiments: offline, the trade-off curve and online
The offline data is 2 million query-item pairs, with relevance labels from the fine-tuned LLM above. Behavioral tasks use AUC and NDCG@10; relevance uses NDCG@10 of the ranking by relevance-head predictions. There are four baselines: MTL-Engagement, trained only on behavioral objectives (no relevance head, with CTR prediction standing in as the relevance score); MTL-Softmax, with a three-class softmax for relevance; MTL-Regression, treating relevance as a continuous value trained with mean squared error; and Auxiliary Only, where the ordinal head is only an auxiliary task and the final score does not use the relevance score.
| Model | Click AUC | Add-to-cart AUC | Conversion AUC | Conversion NDCG@10 | Relevance NDCG@10 |
|---|---|---|---|---|---|
| MTL-Engagement | 0.840 | 0.852 | 0.855 | 0.628 | 0.812 |
| MTL-Softmax | 0.838 | 0.851 | 0.854 | 0.625 | 0.961 |
| MTL-Regression | 0.839 | 0.851 | 0.854 | 0.627 | 0.959 |
| Auxiliary Only | same as below | same as below | same as below | same as below | 0.823 |
| This paper (ordinal head) | 0.838 | 0.851 | 0.855 | 0.627 | 0.962 |
AUC on the three behavioral tasks differs by at most 0.002, and conversion NDCG by 0.001. This shows that adding a relevance head does not by itself hurt behavioral prediction. Relevance NDCG rises from 0.812 to 0.962, but softmax gets 0.961 and regression 0.959, nearly identical, which shows most of the gain comes from "having an explicit relevance head" and the ordinal form adds only a little. Auxiliary Only gets 0.823, 0.011 above baseline, which shows relevance as just an auxiliary task helps little; it must enter the final score.
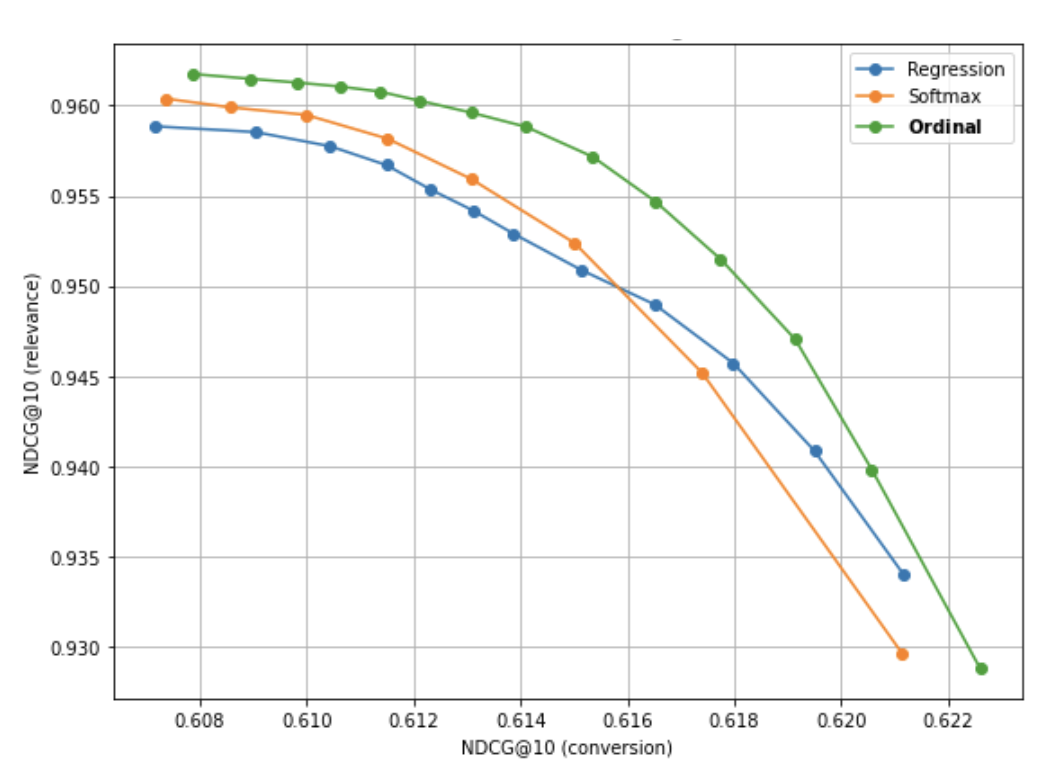
The trade-off experiment linearly weights only the relevance score and the conversion prediction, sweeping the relevance weight. Reading the plot approximately: at conversion NDCG around 0.614, the ordinal head's relevance NDCG is about 0.959, softmax about 0.954 and regression about 0.953; at the left end all three are between 0.958 and 0.962, at the right end between 0.929 and 0.934. This shows the ordinal head's advantage is mainly in the middle of the curve, the compromise region one would actually pick, with little difference at the two ends. The left part of the curve is flat: moving right from the left end, conversion NDCG rises about 0.006 while the ordinal head's relevance NDCG drops only about 0.003. This matches the authors' claim that modest weights buy large relevance gains with little behavioral loss.
The online A/B ran for three weeks, with the treatment replacing the original ranking model with this paper's model:
| Metric | Relative lift | p-value |
|---|---|---|
| Add-to-cart rate ATCR | +1.16% | 0.01 |
| Conversion rate CVR | +1.10% | 0.01 |
| Gross order value GOV | +0.50% | 0.03 |
This shows that in this setting, putting relevance into ranking not only did not sacrifice behavioral metrics but lifted add-to-cart and conversion together, consistent with the intuition that off-topic results also cost transactions.
Limitations as I see them
First, the offline relevance evaluation is circular. Training labels and evaluation labels both come from the same fine-tuned LLM, so relevance NDCG measures "how much the model resembles this LLM", not real users. The 0.812 baseline also comes from using CTR prediction as the relevance score, so part of the 0.962 vs 0.812 gap comes from the baseline never being designed for this metric.
Second, online only behavioral metrics are reported, with no online change in relevance itself, such as a human-sampled irrelevant rate or query-rewrite rate. The control is described only as the original ranking model, and the final relevance weight only as the result of several online treatments, so others can hardly reproduce the same trade-off point.
Third, the two threshold probabilities should in theory satisfy , otherwise the derived "moderately relevant" probability would be negative. The paper does not say how the ordinal relevance head guarantees this order; in your own implementation, use a structure like a shared score with ordered thresholds, or add a constraint.
How a search team could try it
- Start with labels. Take a few tens of thousands of query-item pairs for human three-grade labeling, use behavioral signals and a category model as in steps 2 and 3 to pick suspicious samples for re-check, then fine-tune a small LLM and check exact three-grade agreement and within-one-grade rate on a held-out set.
- Sample the training set to match real production relevance proportions, and check whether the fine-tuned model systematically leans toward one grade.
- Add an ordinal relevance tower to your existing multi-task ranking model using only existing features, and confirm behavioral AUC does not drop.
- Sweep the relevance weight offline, draw a curve like Figure 2, and pick a point before the curve starts to bend down sharply; first check the magnitudes of the behavioral and relevance scores.
- In the online A/B, besides add-to-cart, conversion and order value, add a human-sampled irrelevant rate or rewrite rate to confirm relevance really improved.
Verdict
Using the LLM as an offline labeler and treating relevance as a tunable term in the ranking formula is a cheap and practical path; the ordinal head itself contributes little.
| Dimension | Assessment |
|---|---|
| Importance of the problem | High. "High-click but off-topic" is a common problem in e-commerce search |
| Novelty of the method | Low to medium. Multi-task ranking, ordinal regression and LLM-generated labels are not new; the combination and the audit process are useful references |
| Experimental evidence | Medium. A significant three-week online A/B, but offline relevance evaluation uses same-source LLM labels, and the ordinal head's edge over softmax is only in the middle of the trade-off curve |
| Engineering cost | Low. No online LLM calls, just one extra tower; the main cost is producing 100 million labels offline |
| Worth trying? | E-commerce search teams with multi-task ranking that want to add relevance should try it, starting with the label pipeline and the weight sweep |
How did this read for you?
Hoot made a note. Thanks for the feedback.

One tap, no sign-in; tap again to undo. Only anonymous counts are kept, never who you are.
Discussion
Add experiment details, reproduction notes or a different take. Requires a GitHub sign-in.
Loading the discussion…