SHARE

A personalized reward model has to give the same response different scores for different users, and its training data are user-labeled preference pairs: two responses to the same prompt, and which one the user chose. Such labels are expensive; each user has only a few dozen pairs, and a new user may have a dozen or so. Meanwhile the model can generate as many responses as you like, they just come with no user and no preference label. This paper from Duke University and George Washington University, PerSPL, turns that unlabeled pool into per-user training data. During training it first pushes the mean score of each labeled pair toward 0, so that scores from different prompts become comparable. It then fits, for each user, a monotone "score → probability of being chosen" curve, pseudo-labels only the unlabeled responses it is confident about, and retrains repeatedly on those together with the labeled data. On four benchmarks, PersonalLLM, HelpSteer2, Reddit TLDR (Reddit post-summary preferences) and Chatbot Arena, PerSPL has the highest average accuracy for both seen and new users. Broken down, though, the gains land mainly on seen users. In the authors' own ablation, unlabeled data improve new users by only 0 to 0.6 points, within the error bars.
1. Why unlabeled responses can't be used directly
Reward models are usually trained with the Bradley–Terry (BT) loss: user prefers over for prompt , and the model scores them and ,
This loss looks only at the difference between the two scores. Add 100 to both scores for the same prompt and the loss is unchanged, as is the ordering within that prompt.
That is fine for comparing two responses to the same prompt, but it becomes a problem for a single unlabeled response. To pseudo-label a response as "this user will like it" or "won't", you have to compare its score with a threshold shared across prompts. The paper's example: prompt a's two responses score (101, 100) and prompt b's score (1, 0). Both are ordered correctly within their prompt, but prompt b's chosen response (1) is lower than prompt a's rejected one (100), and no single threshold separates them. The authors call this score-coordinate ambiguity: the pairwise loss pins down the difference but not where each pair sits as a whole. Note that this only affects cross-prompt comparison and single-response classification. If you only pick the best of N responses to the same prompt, any offset added to the whole prompt cancels out.
Existing semi-supervised reward-model methods learn a single reward shared by all users and pseudo-label with one global threshold, so they cannot handle "the same response has different labels for different users".
2. Method
2.1 Score centering
Since nothing constrains the mean of each pair's scores, add a term that pushes it toward 0:
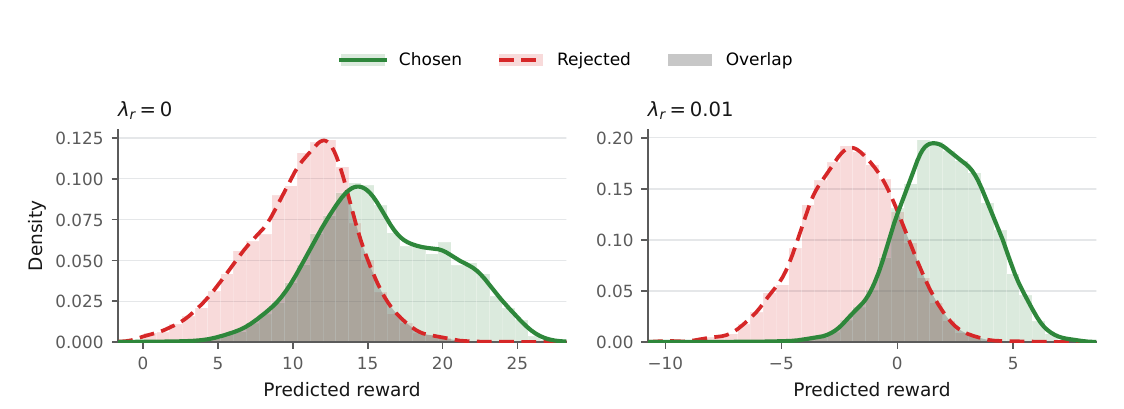
The expectation runs over all labeled pairs of all users. In the example above, both pairs get pulled to about (0.5, −0.5): the within-prompt ordering is unchanged and the cross-prompt comparison becomes correct. All main experiments use weight for this term.
The appendix gives a theoretical analysis of this term. In a linear model under a Gaussian assumption, the authors prove that adding a small centering term raises single-response classification accuracy at first order in , while the pairwise loss worsens only at second order, so at small weights it is almost free. There is a precondition, though. Split a pair's representations into two parts: their average, the "shared part", and their difference, the "differing part". Write for the mean of the differing part, and , for the covariance matrices of the shared and differing parts. The precondition is that does not point the same way as ; intuitively, the shared part and the differing part vary in differently shaped ways, so the best scoring direction for pairwise judgment is not the best one for single-response classification. Then the centering term rotates the scoring direction toward one better suited to single-response classification. If they point the same way, it only rescales the scores and brings nothing. On real data, the authors swept on HelpSteer2 and Reddit TLDR. At 0.01, same-prompt pairwise accuracy changes by −0.02±0.14 and 0.00±0.36 points, so pairwise judgments are indeed unharmed. Precision of the most confident 10% of candidate pseudo-labels rises by 2.16 points on HelpSteer2, while on Reddit the change has an interval containing 0.
2.2 One calibration curve per user
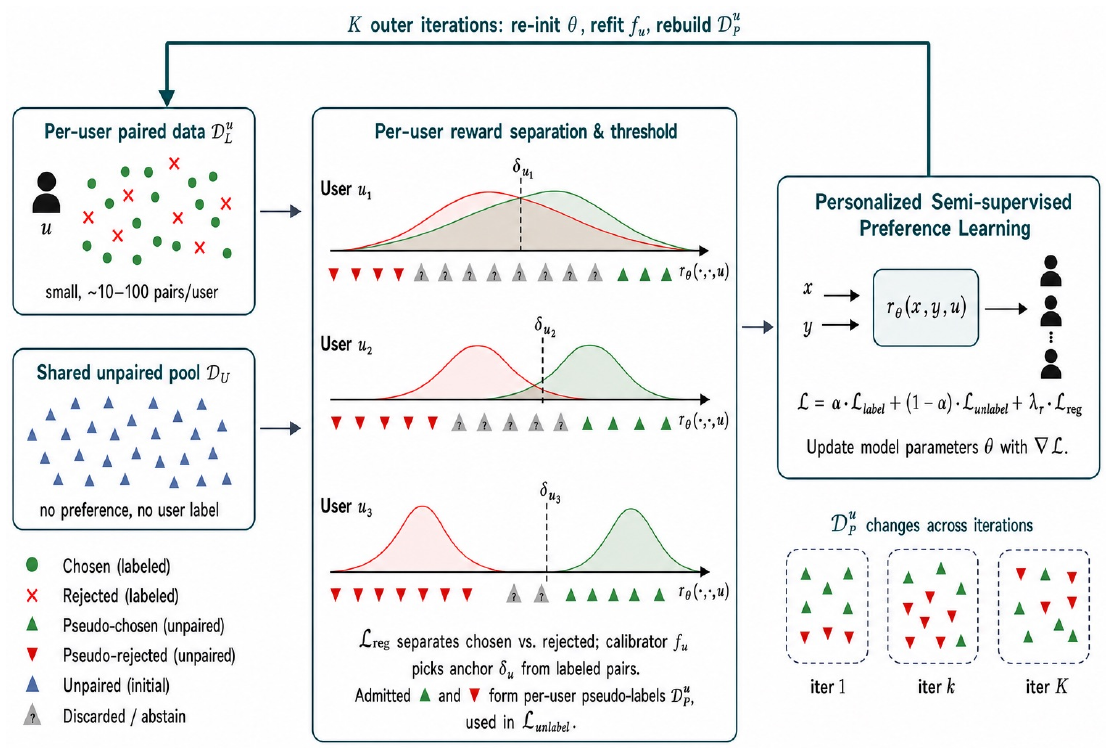
With comparable scores, the next step is to set each user's threshold. For each of user 's labeled pairs, label the chosen response's score 1 and the rejected one's 0, and fit a monotone non-decreasing function by isotonic regression, giving "the probability that this score falls on the chosen side". The first point where reaches 0.5 is the user's threshold .
For an unlabeled response, compute its score for user . If it is labeled liked, if disliked, and anything in between is abstained on and left out of training. The pseudo-label loss uses as the boundary:
is the pseudo-label. The same response lands at different points on different users' curves, so it can receive different labels.
2.3 Iterative self-training
The first round trains only on labeled data plus the centering term, giving an initial model and each user's calibration curve. Each later round re-pseudo-labels the unlabeled pool with the current model (drawing 1,000 candidates from the pool per user each time), reinitializes the model, and trains on . Calibration curves are fitted on labeled data only, so pseudo-label errors cannot feed back into the thresholds.
The architecture is the same as the LoRe baseline: on top of a frozen 4,096-dimensional last-token LM representation, it learns linear scoring directions (the basis, = 2 or 5), each turning the representation into one score. Each user also has a set of non-negative mixture weights summing to 1, and the user's reward for a response is the weighted sum of the scores. A new user fits only their own mixture weights and the bases stay fixed. So PerSPL differs from LoRe only in training data and loss.
3. Experiments
The four benchmarks span two axes, "are the responses real" and "are the users real": PersonalLLM has synthetic responses and simulated users; HelpSteer2 has human-rated responses and users simulated from attribute weights; Reddit TLDR and Chatbot Arena have real preferences from real users. Seen users take part in joint training; new users adapt from a small support set only. The metric is within-prompt pairwise accuracy, averaged over five random seeds.
3.1 Main results
The seven baselines are user-agnostic BT, two methods that feed user information into the model, two methods that add a small per-user module (one of them LoRe), the meta-learning method MRM, and the off-the-shelf Skywork V2 reward model. The table lists the most representative:
| Method | PersonalLLM seen/new | HelpSteer2 seen/new | Reddit TLDR (100 pairs) seen/new | Chatbot Arena seen/new |
|---|---|---|---|---|
| BT | 88.8 / 89.0 | 63.0 / 63.2 | 63.2 / 64.3 | 80.3 / 78.1 |
| LoRe | 94.6 / 94.0 | 69.6 / 70.1 | 65.3 / 68.4 | 81.3 / 78.4 |
| MRM | 91.6 / 92.0 | 70.7 / 70.9 | 70.0 / 69.8 | 80.7 / 77.2 |
| PerSPL | 95.7 / 95.5 | 71.6 / 71.2 | 70.7 / 70.1 | 83.0 / 81.0 |
PerSPL has the highest mean in every column. Against LoRe, which shares its architecture, seen-user accuracy on Reddit TLDR rises from 65.3 to 70.7, which shows the gap comes mainly from the training data and loss.
To check that the lead is not a matter of random seeds, the authors run paired bootstrap tests against the strongest overall baseline in each setting. There are five settings: the four benchmarks, with Reddit TLDR at 100 and 150 labeled pairs per seen user. Every interval for seen users and for overall accuracy (both user groups pooled) excludes 0, and four of the five intervals for new users do.
Note that PerSPL uses different hyperparameters per benchmark. The confidence threshold ranges from 0.6 to 0.9, the learning rate from 0.01 to 0.3, the labeled-loss weight from 0.6 to 0.8, and the basis rank is 2 or 5. The baselines each use one benchmark-level configuration, and the paper does not say on which data these configurations were chosen.
3.2 2×2 ablation: is it the centering term or the unlabeled data?
On two settings each of HelpSteer2 and Reddit TLDR, the centering term () and unlabeled training (a single round) are switched on and off. The table shows two of the settings. HelpSteer2's simulated users are defined by weights over rating attributes, and the 0.1 in brackets is the parameter that sets how much those weights differ between users; for Reddit TLDR the bracket gives labeled pairs per seen user:
| Configuration | HelpSteer2 (0.1) seen / new | Reddit TLDR (150 pairs) seen / new |
|---|---|---|
| Full PerSPL | 71.6 / 71.2 | 70.9 / 70.3 |
| Unlabeled data, no centering | 66.5 / 69.7 | 62.5 / 62.5 |
| Centering, no unlabeled data | 70.9 / 71.0 | 69.1 / 70.3 |
| Neither | 70.9 / 71.1 | 69.0 / 69.6 |
Adding only the centering term changes seen-user accuracy by at most ±0.1. Adding unlabeled data without centering costs seen users 2.9 to 6.5 points across the four settings; adding it with centering gains 0.5 to 1.8. So the centering term barely helps on its own; its job is to turn unlabeled data from harmful into useful.
The new-user column calls for a discount on that conclusion. With centering on, adding unlabeled data gains new users only 0.2, 0.4, 0.6 and 0 points across the four settings, while the standard deviations of these results are 0.5 to 1.0. That is, PerSPL's lead on new users in the main table comes more from centering and the overall training configuration than from the unlabeled data itself. This fits the design: a new user fits only their own mixture weights, and unlabeled data mainly improve the bases learned on seen users.
3.3 Hyperparameter sensitivity
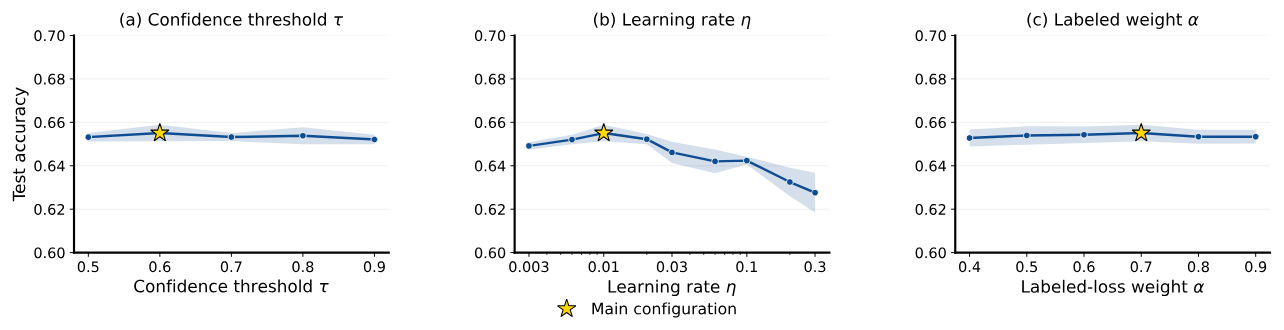
Varying the confidence threshold from 0.5 to 0.9 moves overall accuracy by only 0.30 points. , which means no abstention at all and pseudo-labeling every candidate, is only 0.19 points below the main configuration. Varying from 0.4 to 0.9 spans 0.23 points. So "pseudo-label only confident responses" does very little here; what matters is that centering makes scores comparable and thresholds trustworthy. The learning rate matters more: going from 0.01 to 0.3 loses 2.75 points.
3.4 Label noise, label budget and distribution shift
Against the strongest baseline MRM on HelpSteer2, as the fraction of randomly flipped preference labels goes from 0 to 0.5, PerSPL stays ahead, and its lead grows with the noise. With half the labels flipped it leads by 6.69 points, suggesting calibration and pseudo-labels partly correct noisy labels. As seen users' labels grow from 50 to 200 pairs, PerSPL's lead stays around 1 point and does not vanish with more labels.
The distribution-shift experiment tests whether the unlabeled pool still helps when its responses come from other generators. On PersonalLLM with a fixed 20% label flip (to avoid saturated accuracy), the default responses come from six generators including GPT-4o and Claude 3. The share of the unlabeled pool drawn from two unseen generators, Command R+ and GPT-4 Turbo, varies from 0 to 1. Relative to a labeled-only model, the overall gain falls from 3.21 to 0.66 points, with every interval above 0. Broken down, when the pool is entirely from new generators, seen users are still 1.5 points higher, while new users score 82.45 against 82.66, slightly below not using unlabeled data at all. That matches the observation in Section 3.2.
4. Limitations
The authors list these in the appendix. Each user's calibration curve needs labels as anchors, so zero-shot new users are out of scope. Filtering pseudo-labels by confidence may overrepresent "easy" response regions, and the authors did not measure pseudo-label precision and coverage by user subgroup. Distribution shift is tested with only two generators. All experiments train a reward head on frozen representations, with no end-to-end fine-tuning control. There are at most 200 users, so behavior at production scale is unknown. Only English instruction following, dialogue and summarization are tested. In addition, the LoRe baseline's code is licensed for academic use only.
One more: the experiments evaluate the reward model's pairwise accuracy and never plug it into downstream policy training or response selection.
5. Practical implications
If you build personalized ranking or personalized reward models and have plenty of unlabeled candidates, PerSPL's first step is the one most worth borrowing. Add a term to the pairwise loss that pushes each pair's mean score toward 0, then check whether scores across different requests are comparable. The ablation shows this step is a prerequisite: without it, self-training loses 3 to 6 points. The second step, fitting per-user isotonic calibration and pseudo-labeling unlabeled responses, gives existing users 0.5 to 1.8 points. For new users, this paper's data are not enough to show it helps.
How did this read for you?
Hoot made a note. Thanks for the feedback.

One tap, no sign-in; tap again to undo. Only anonymous counts are kept, never who you are.
Discussion
Add experiment details, reproduction notes or a different take. Requires a GitHub sign-in.
Loading the discussion…