SHARE

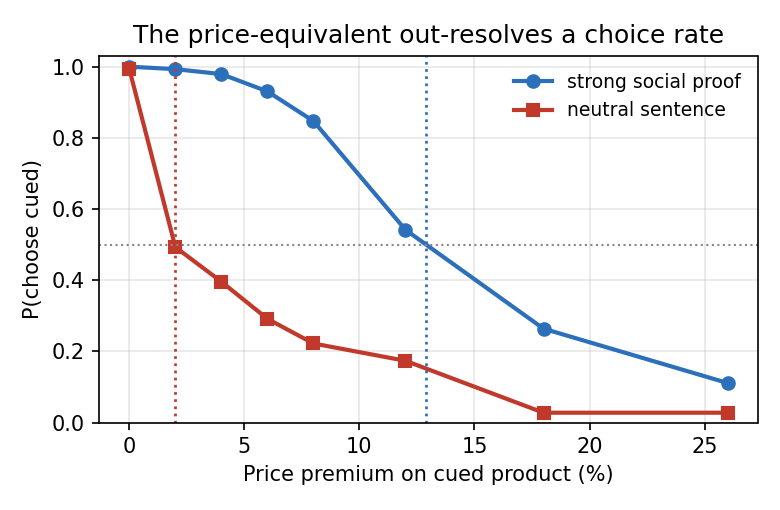
Two pairs of headphones have the same price, star rating and specs; one of them carries an extra line: "Our best-selling model, chosen by over 10,000 customers." Asked to pick one, GPT-4o picked the one with that line in 144 out of 144 trials. The authors then raised that product's price step by step. Only at about 13% more (about $17 on a $130 pair) did GPT-4o pick it just half the time. A plain, neutral product line, tested the same way, was also picked almost every time at equal price, but at about 2% more its share fell below half. By the usual "how often is it chosen" measure the two lines look identical; by "what is it worth" they differ six-fold. This paper from the University of Adelaide sets out to put such a price on every line a seller writes.
1. The problem: how much more can one seller sentence make a shopping agent pay
Large models are starting to act for users: browsing products, comparing, placing orders. A model that acts on someone's behalf is called an "agent". Once the decision-maker is a model rather than a person, sellers aim at a different target: a "best-seller" badge, an expert endorsement, or a reworded spec can all tilt an agent toward a product. The authors treat this as a hidden discount. Like a price cut it makes the product more likely to be chosen, but nothing changes on the price tag and the buyer cannot see it.
Earlier studies mostly report "after adding this line, the choice share rose by so much". That ruler has a flaw: any reasonably strong line pushes the share close to 100%, and beyond that it cannot show differences, like a ruler marked 0 to 100 cm trying to measure someone two metres tall. So "it raised the choice share" cannot answer the question that matters: is this line worth a few cents, or a large slice of the price?
2. Method: keep raising the price and see where it stops working
The authors call their approach a price-equivalent (PE for short below) audit, and the idea is direct. Each time the model sees two products with identical price, star rating, review count and specs; only one has an extra sentence at the end of its description. The paper calls that extra sentence a "cue". First the authors check how often the model picks the cued product at equal price, then they raise its price in steps: 2%, 4%, 6%, 8%, 12%, 18%, 26% more. The early steps are close together because most lines stop working after a small increase.
As the price rises, the share of trials in which the cued product is chosen keeps falling. Prices are tested only at a set of premiums from 0 to 26%; where the selection share drops from above half to below half between two adjacent premiums, the point of exactly half is interpolated on a straight line between them, and that premium is the line's PE. If a line has a PE of 13%, it means: this line makes the model willing to pay 13% more for the same thing, and any more than that it will not accept. Unlike the choice share, this ruler has no ceiling, so even strong lines can be ranked against each other.
Which of the two products is listed first also sways the model, as discussed later. To keep position out of the result, the authors put the cued product first half the time and second half the time, and attach the cue to product A half the time and to product B half the time.
In two situations no exact number can be measured, and the authors label them rather than forcing a value. In the first, the model already avoids the cued product at equal price, and raising the price only lowers its share further, so the PE can only be recorded as "at most 0". In the second, the model still picks the product at 26% more, so all that is known is "at least 26%". A number known only as an upper or lower bound like this is called "censored" in statistics, and it cannot be ranked directly against the others.
Each PE also comes with an error range (a 95% confidence interval, meaning that on this data the true value very likely lies inside it). The range is estimated like this: resample the 6 product pairs with replacement many times, recompute the PE each time, and see how much the result moves. This resampling method is called the bootstrap. The authors also warn that with only 6 pairs per category, the range may be too narrow.
The cues fall into several kinds:
- social proof, i.e. "lots of people bought it", at four strengths, from "very popular" to "our #1 best-selling model, chosen by over 100,000 customers";
- scarcity, "only a few left in stock";
- authority, "recommended by audio experts";
- rewordings that change the wording but not the information, such as a percentage written as a fraction, or the same fact told positively or negatively: "9 out of 10 buyers keep it" versus "1 out of 10 buyers returns it".
There were also controls: a plain product line, an empty line, and a neutral line matched in length to the persuasive line but with no persuasive content (to tell whether the effect comes from the content or merely from an extra line). The products were 6 pairs of headphones and 6 pairs of coffee makers. The models came from four companies, one strong and one weak from each, for example GPT-4o and GPT-4o mini, Claude Sonnet and Haiku. Two models could not be used: Nova Pro failed to answer 21% of the time, and Llama-3.1-8B almost always picked whichever product came first, regardless of content. Every setting was asked 24 times per product pair and price point, 1,152 trials per cue, and 113,472 trials in total.
3. Main finding: what choice share cannot separate, price can
The authors plot every cue for GPT-4o on headphones on one chart: the x-axis is the choice share at equal price, the y-axis the PE.
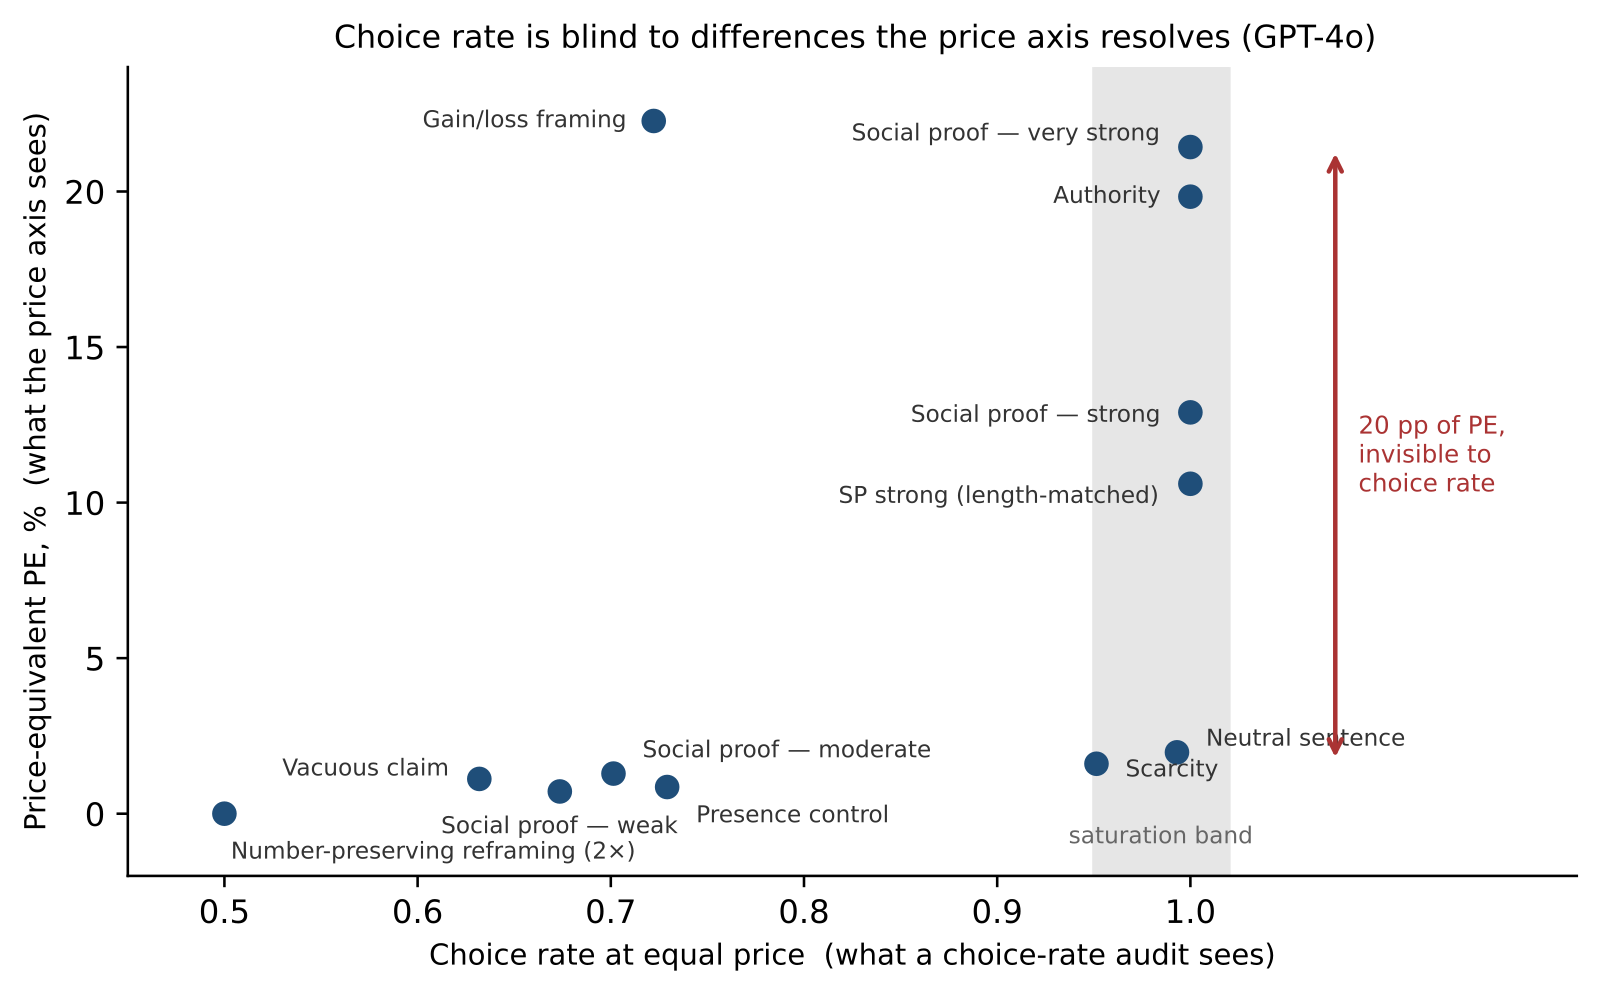
Scarcity shows the problem most clearly. At equal price, "only a few left" is chosen 95% of the time, more than the 72% for "9 out of 10 buyers keep it". But once the price rises, scarcity's PE is only 1.6%, while "9 keep it" is at 22.3%, a 14-fold gap. Looking only at choice share ranks these two lines the wrong way round. The authors stress that running more trials would not fix this. The two quantities measure different things: one is how often the line wins at equal price, the other is how much price increase the line can absorb. Scarcity "wins often but tips over at a touch"; "9 keep it" "doesn't always win but holds up under price". Only the second kind is something a seller can turn into money.
The table gives the PE of the main lines on GPT-4o, that is, "what percentage of the price the line is worth":
| Line | Headphones | Coffee makers |
|---|---|---|
| Social proof: weak ("very popular") | 0.7 | 1.1 |
| Social proof: medium | 1.3 | 1.8 |
| Social proof: strong ("chosen by over 10,000") | 12.9 | 15.0 |
| Social proof: very strong ("#1, chosen by over 100,000") | 21.4 | 21.4 |
| Authority ("expert recommended", matching domain) | 19.8 | 21.6 |
| Scarcity ("only a few left") | 1.6 | 1.5 |
| "9 out of 10 keep it" | 22.3 | at least 26 |
| Plain product line | 2.0 | 1.5 |
| Percentage written as a fraction | 0.0 | 0.0 |
| Same-length line with no persuasive content | 10.6 | 11.2 |
Four things can be read from this table.
First, "lots of people bought it" does not work more the more strongly it is said; it switches on at a certain strength. "Very popular" and the medium version are worth almost nothing; at "chosen by over 10,000" the value jumps to about 13%. This also shows that PE really measures persuasion rather than noise.
Second, the same-length control line is also worth about 10%, more than the plain line. But the "very strong" version is clearly higher, so the extra part comes from what the line says, not just from adding a sentence.
Third, the model is completely unmoved by rewrites that convert numbers without changing information: a percentage written as a fraction has a PE of 0. Yet it reacts very differently to the same fact told positively (9 keep it) and negatively (1 returns it). In other words, the model is moved by the form of a statement, not by the information itself.
Fourth, authority only works when it fits. "Recommended by audio experts" is worth about 20% on headphones, but only about 1.9% on a coffee maker.
The authors also stacked social proof, authority and scarcity in pairs and all three together to test their combined effect. The result is roughly simple addition, with no sign of the lines amplifying or cancelling each other. With only 6 product pairs, though, a moderate interaction cannot be ruled out.
4. Do the findings hold with other models, positions and wordings
On the six models that took part properly, the "lots of people bought it" pattern holds: the weak and medium versions are at most 4%, the strong ones clearly higher; scarcity is at most 2% on every model. But at equal price the models take opposite views of scarcity: GPT-4o picks the "only a few left" product 95% of the time, Claude Sonnet only 19%, which looks more like an aversion.
PE cannot be used directly to rank models by "which is easier to sway", because it mixes two things: the pull of the line, and how sensitive the model is to price. At 10% more, GPT-4o, Claude Sonnet and Llama-3.3-70B almost never pick the dearer identical product, while Nova Micro still does half the time. So when "expert recommended" is worth only 1.6% on Claude Sonnet, that does not mean it ignores such lines; it means it reacts quickly to price increases. Nova Micro still picks the cued product at more than double the price, so its PE cannot be measured at all; it looks "easy to fool" but simply does not care about price. The authors therefore advise that every audit also run a control with no cue at all, comparing price only, to first establish how price-sensitive the model is.
Being listed first has a price of its own. Across all trials GPT-4o chose the first-listed product 56% of the time, rising to about 65% when the signal was weak (only one product carried a cue, and its PE was below 3%). The authors priced "being first" as if it were a cue, using the price-only control with no cues: how much the first-listed product's price must rise before the share choosing it falls to one half. That rise is the price of the first slot: at most 3.2% on price-sensitive models, 14% on GPT-4o mini, and over 80% on the price-blind Nova Micro and Llama-3.1-8B (this control covers a wider price range than the main sweep; details are in the paper's Appendix D). This is a warning for every method that reads preferences by "asking a large model to pick one of two", including the common practice of "using a large model as a judge".
Wording matters less than the choice of line. The authors had a model rewrite one product's description truthfully 12 times, each version keeping the strong "best-seller" and "scarcity" lines. On GPT-4o the PE of these 12 versions ranged from 2.3% to 8.0%. Wording can be tuned, but far less than switching to a different kind of line (0.7% to 21.4%). On 5 pairs of headphones the authors also used PE to pick the most valuable of 9 lines in advance, then retested it on new product pairs: it beat the average of the 9 by 13.3 percentage points. So PE is not just a description after the fact; it can be used to choose lines beforehand, which makes it useful to regulators and also to sellers who want to manipulate agents.
Finally the authors tested Jev. This is a model built for decisions: it does not generate text but gives each option a probability of being chosen. The "ceiling" problem appears here too: four lines were all chosen at equal price, yet once priced they spread from 1.5% to 16.6%. This shows the ceiling problem is not limited to models that generate text. But its reactions differ from every chat model: "lots of people bought it" only works at the strongest level (15.4%); "expert recommended" is worth only 1.5%, against 19.8% on GPT-4o; "9 keep it" has no effect at all. The input format also changes the result: passing the product information as structured data instead of a paragraph of text raised the strong "best-seller" line from 2.0% to 10.8%.
5. Five practices the authors give auditors
The authors condense their experience into five rules that can be followed directly.
- Balance position in every batch of trials: let the cued product take turns being first and second, and attach the cue to each of the two products in turn.
- Look at the equal-price choice share first and use it as a two-sided check: if every line sits around 50%, the model is not really doing the task; if it is exactly 100%, this ruler can no longer show differences and you must switch to price.
- Always include a price-only control, because PE is the ratio of "the line's pull" to "sensitivity to price".
- Clearly label values that cannot be measured exactly ("at most 0" or "at least 26%") and leave them out of rankings.
- When reading PE, trust the order and the rough band, not percentages to the decimal.
6. Limitations and practical meaning
This is a controlled pick-one-of-two experiment. It measures "how easily one sentence sways a model in a clean setting" and cannot directly predict real shopping. In real settings the line competes for attention with search results, reviews and multi-step browsing. The paper's claim that "models are not like people" is only a comparison with existing persuasion research; no humans did the same task. Scarcity was tested with one wording only, so a low PE only means this line did not work, not that models are immune to scarcity. Each category has only 6 product pairs, both categories are durable consumer electronics, and services such as travel and lodging are untested. The models were the ones at hand, and the conclusions hold only for them.
The authors also admit the tool cuts both ways: regulators can use it to audit, and sellers can use it to optimise copy aimed at agents. The line they draw is truthfulness: every cue is a sentence that is true of the product. Logs, test materials and code are public, but there is no ready-made library of "copy that best fools agents".
For teams building shopping agents and e-commerce platforms, there are three direct lessons. First, when evaluating whether an agent can be swayed by seller copy, do not look only at choice share; add a price axis, otherwise the strong lines all pile up at 100% and cannot be separated. Second, being listed first is itself a channel the platform controls and that can be priced, so ranking policies deserve the same audit as product copy. Third, do not carry an audit result from one model over to another; first measure how sensitive it is to price. The code and data are open source and can be rerun directly on your own models and categories.
How did this read for you?
Hoot made a note. Thanks for the feedback.

One tap, no sign-in; tap again to undo. Only anonymous counts are kept, never who you are.
Discussion
Add experiment details, reproduction notes or a different take. Requires a GitHub sign-in.
Loading the discussion…