Contents · 7 sections
1One cluster needs several compute splits within a few hours2Existing systems miscount in three places3Any node can play either role, and KV lives in a shared pool4Each KV block keeps a count of active branches still using it5The planner sizes the split by average work, not short bursts6Switching drops from 754 s to 6.2 s7Limits lie in TTFT, the harness, and the hardwareSHARE

An agent sends one model request per step, and consecutive steps share long prefixes, so the KV cache can be reused across steps. The production serving systems the paper discusses split nodes into a group that only does prefill (processing input) and a group that only does decode (generating output), but different agents need very different splits. Out of 9 nodes, a math-proof agent does best with 2 to 7 and a computer-use agent with 6 to 3, and the mix of agents in a cluster also shifts over time. Existing systems either stop and restart to switch roles (Dynamo averages 754 s per switch across 9 settings) or switch in place and lose reusable KV (Arrow lost 55.5% in one test). Evolving Infra lets any node serve both phases without restarting and keeps KV in a shared pool built from every node's host memory, with an average switch time of 6.2 s. So when serving agents, how many machines process input, how many generate output, and which KV to keep should all change online with the load. What makes that affordable is first separating "which role a node plays" from "where the KV lives".
One cluster needs several compute splits within a few hours
Agents run in steps. Each step sends one model request and triggers some tool calls, and the harness (the outer program that drives the agent, such as Claude Code itself) writes the results back into the context. Consecutive prompts therefore usually share a long prefix, and the KV cache computed in one step can be reused in the next.
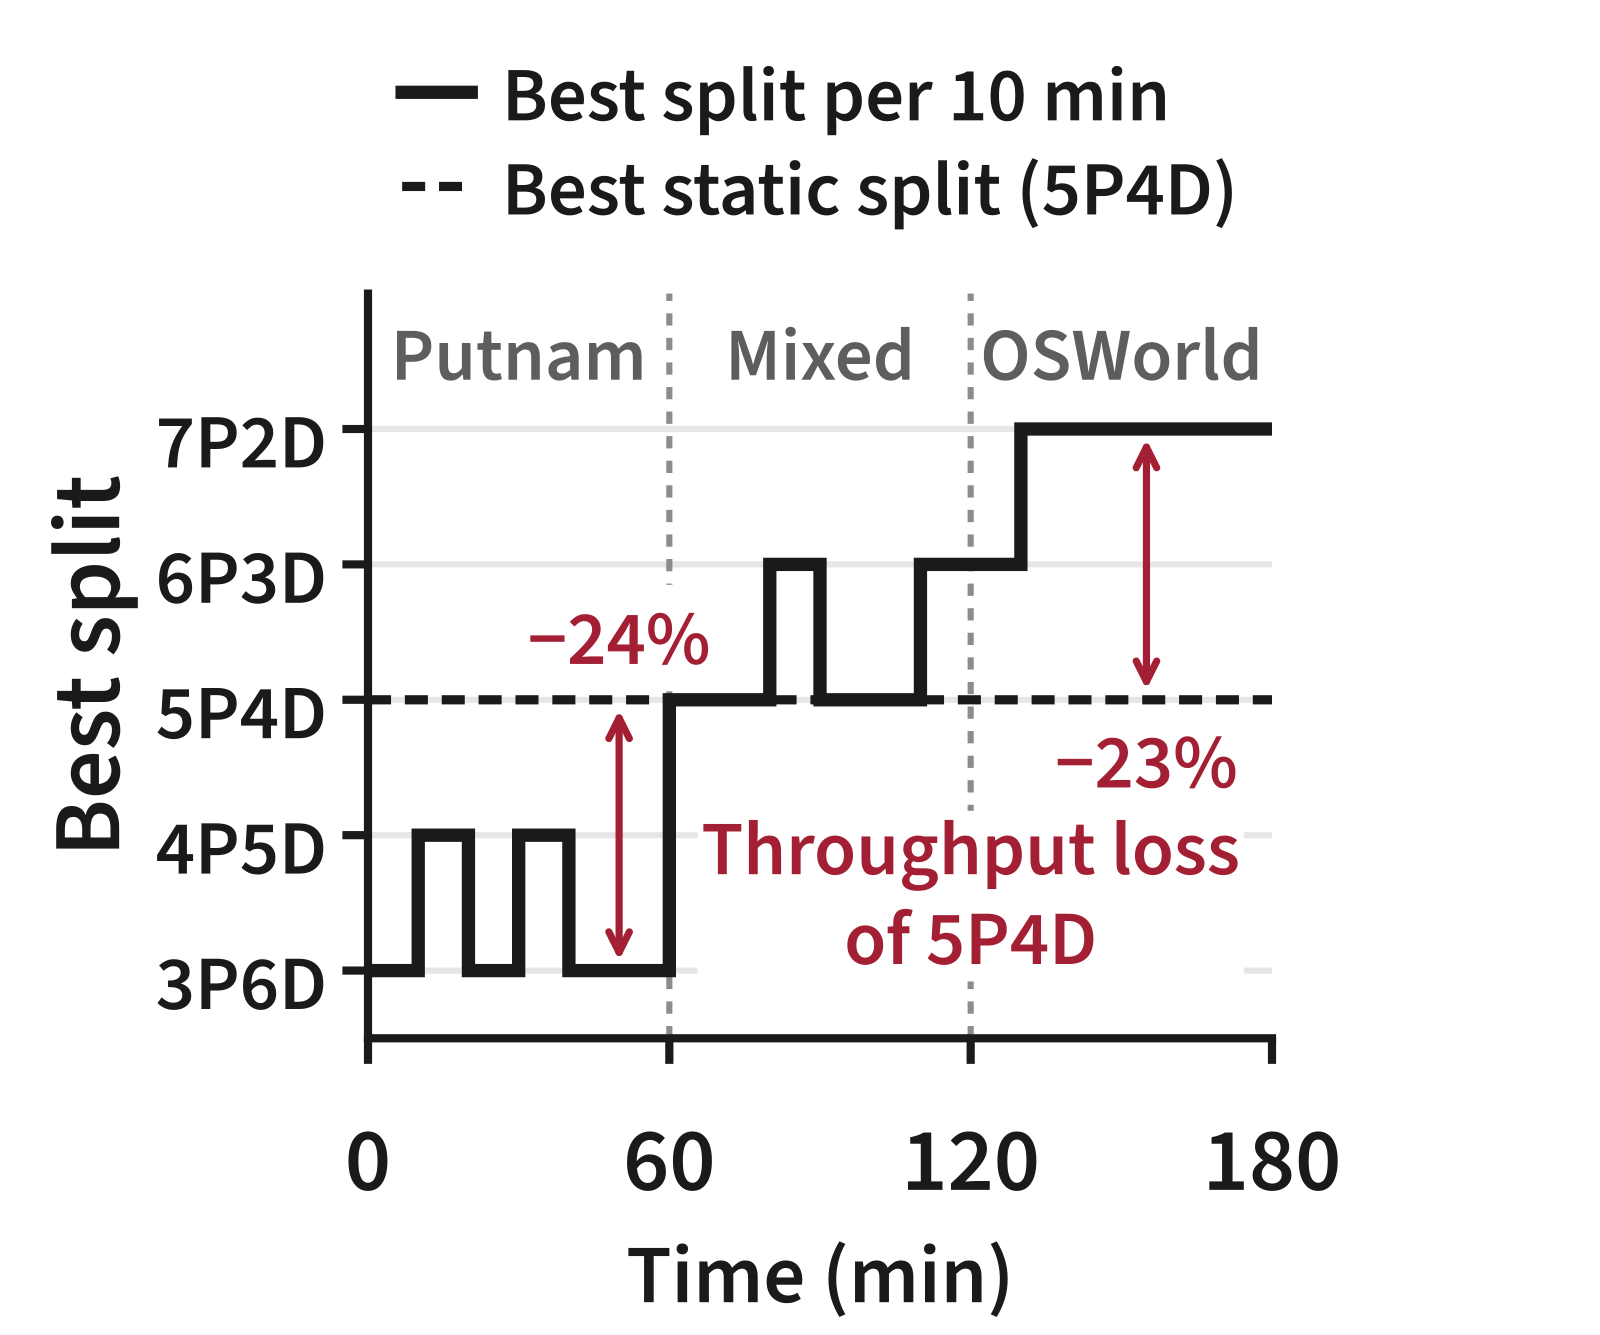
The production serving systems the paper discusses use PD (prefill and decode) disaggregation: some nodes only run prefill (turning new input into KV), and the rest only run decode (generating token by token). The paper writes a split as xPyD; 4P5D means 4 of 9 nodes do prefill and 5 do decode. The difficulty is that agents differ widely in what they need from each side. The Putnam agent proves math theorems and emits long reasoning, so it is decode-heavy and its best static split is 2P7D. The OSWorld agent operates a computer and appends a screenshot every step, so it is prefill-heavy and its best split is 6P3D. The mix of agents in a cluster also changes over time.
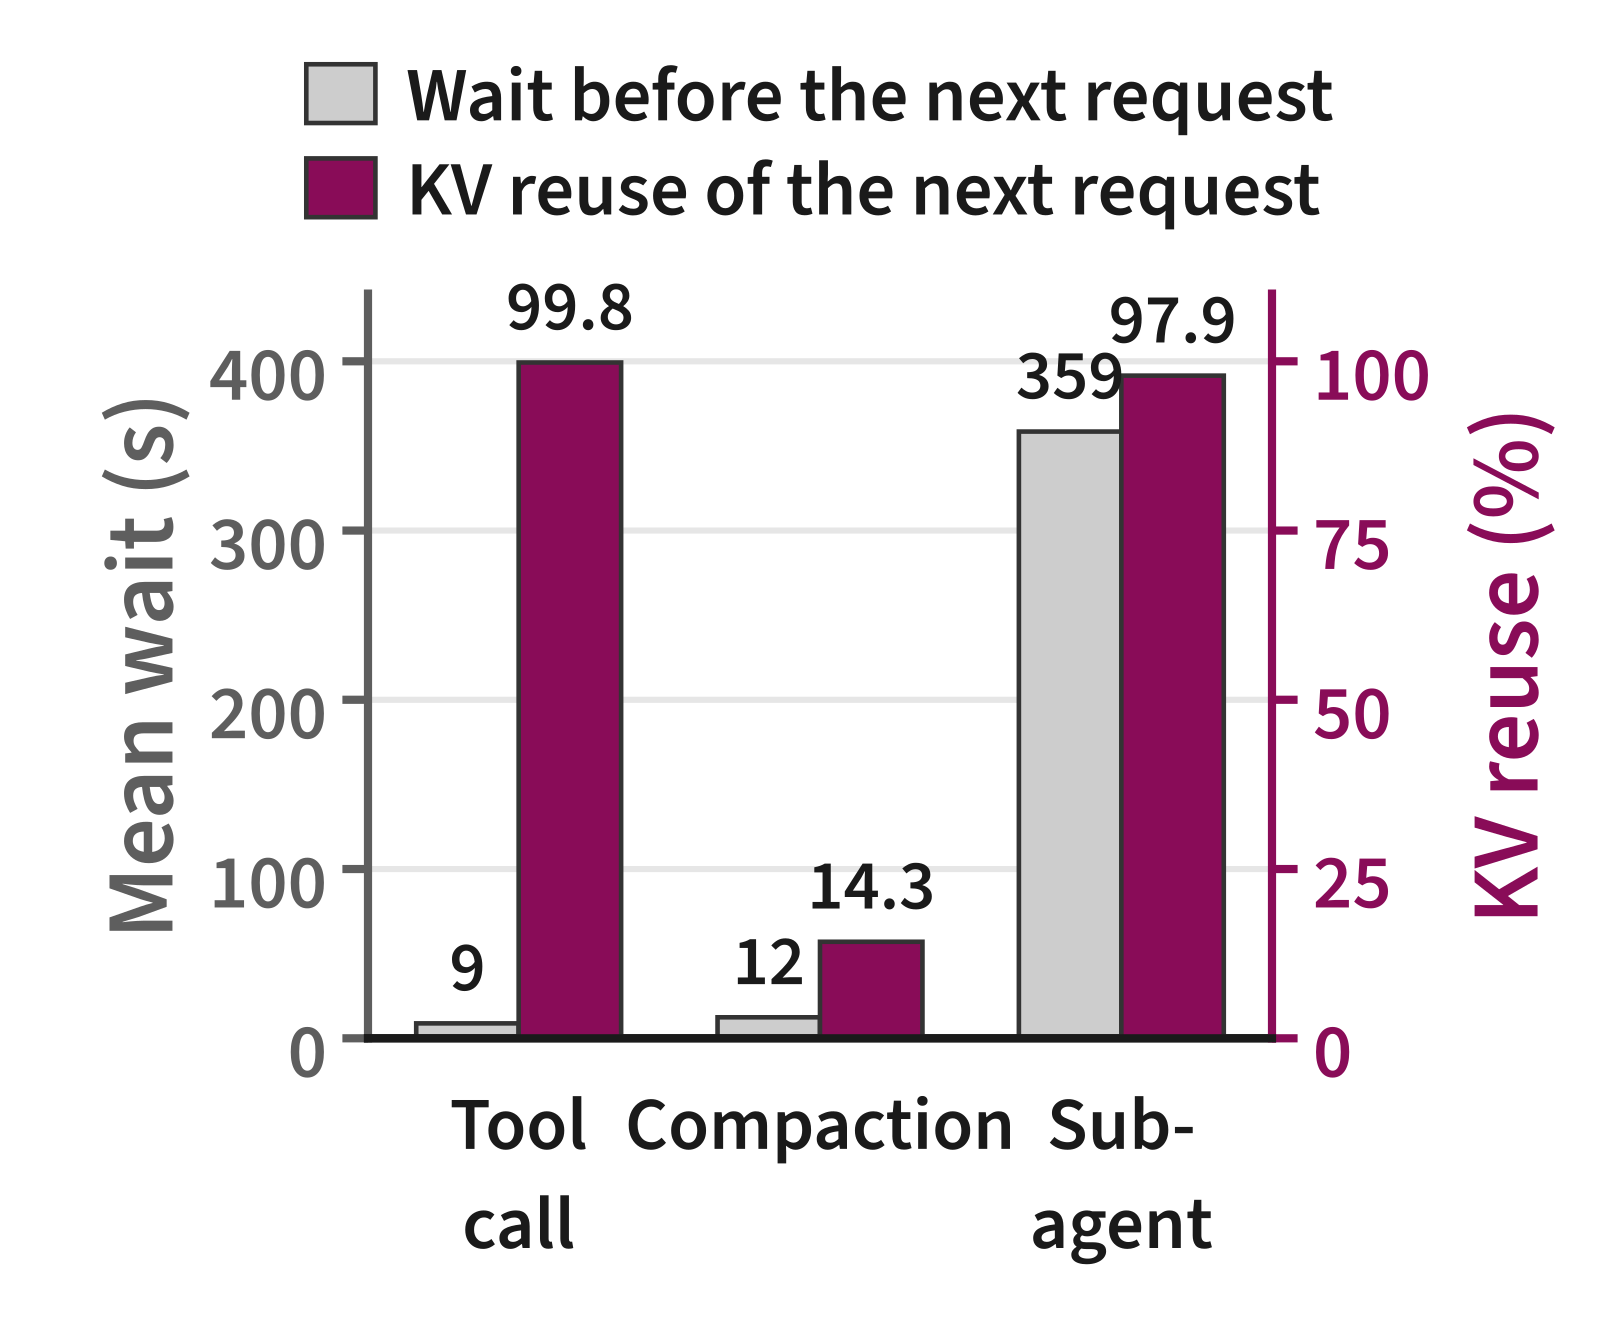
The second difficulty is deciding which KV to keep. Intuition says the KV unused for longest should go first, but agent reuse does not depend on recency. On real Claude Code user traces (CC below), the authors measured reuse after sub-agents and after compaction (the harness compresses a long history into a summary). After a sub-agent runs 359 s and returns, 97.9% of the next prompt still matches existing KV. Only 12 s after a compaction, the match is 14.3%. This means recency cannot predict whether KV is still useful, because reuse is decided by what the harness did to the context.
Here is a running example (illustrative) that contains both difficulties. The cluster has 9 nodes and currently runs 4P5D. The paper calls a context with its own request sequence, active until it finishes, a branch. Agent A's main branch is B1, and its 100K tokens of KV sit on prefill node P1. B1 has launched a sub-agent B2 to read code and has been waiting for 6 minutes. Agent C's branch B3 finished a compaction 12 s ago, compressing an 80K history into a 5K summary. The load is now more decode-heavy, so 3P6D would be better, and P1 is the node to turn into decode.
Each existing system goes wrong somewhere in this example. The Dynamo planner restarts the worker on P1 to change the split, and P1 serves nothing for minutes. Arrow switches in place, but P1's KV is indexed only in P1's local state. Once P1 becomes a decode node, other prefill nodes cannot read B1's 100K prefix and must recompute it. Under LRU eviction, B3's 80K old history was touched 12 s ago and is kept, while B1's prefix has been idle for 6 minutes and is evicted first. That is exactly backwards.
Existing systems miscount in three places
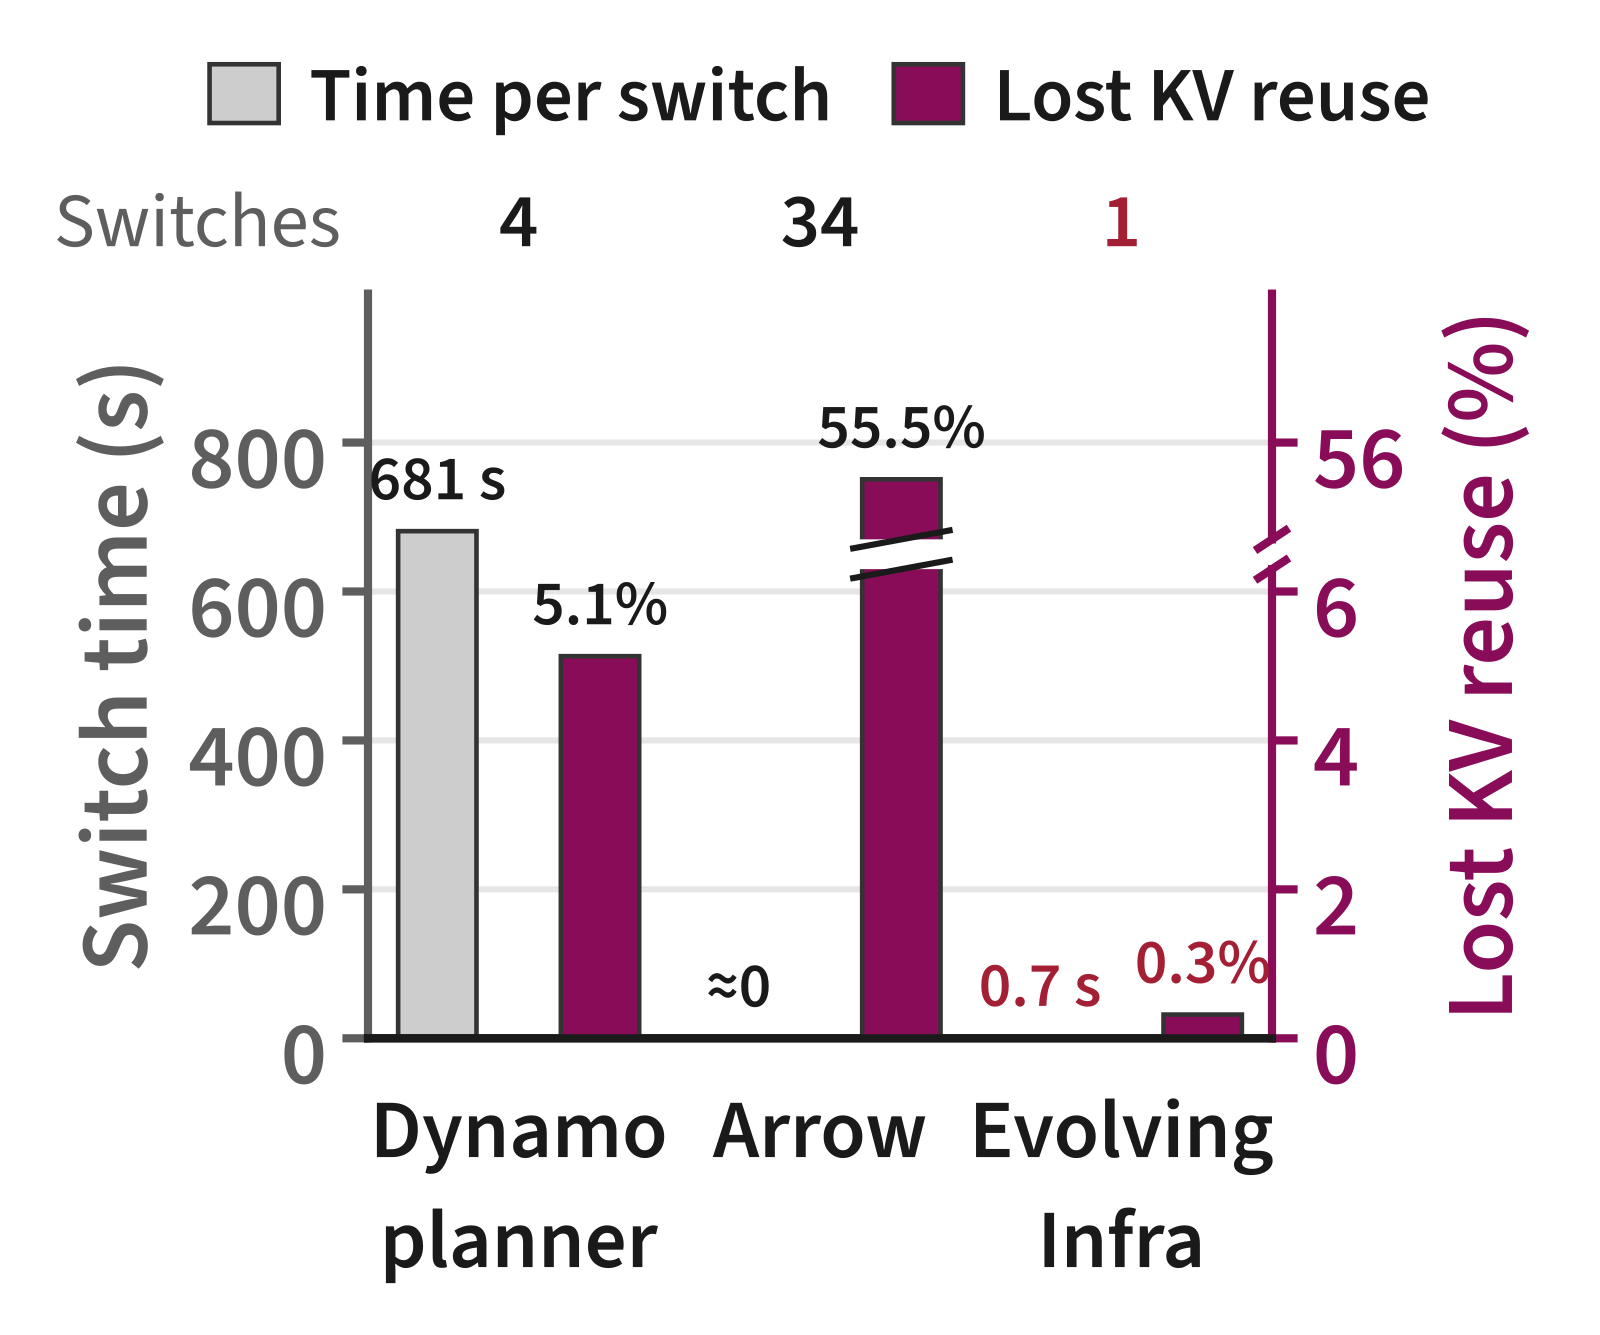
The authors ran the CC workload on 9 nodes of 4×GB300 and put numbers on these errors. The first is the cost of switching: a Dynamo switch takes 681 s on average, and the node serves nothing meanwhile. Arrow switches almost instantly, but after 34 switches it loses 55.5% of the available KV reuse, because the KV on switched nodes can no longer be read.
The metric here is lost KV reuse, defined as 1−h/h. h is the actual hit rate, and h is the hit rate with an unlimited cache shared by all nodes and no switches, so the metric measures the fraction of hits that could have happened but did not.
The second is misjudging compute demand, in opposite directions. Arrow predicts prefill time from the full input length, counting cached prefixes as work, and keeps adding prefill nodes until 8P1D. Dynamo follows queue depth and KV utilization; long agent contexts keep decode KV utilization high, so it keeps adding decode nodes until 2P7D. Their throughput is 65% and 49% below the best static split (4.9 req/s).
The third is misjudging reuse in routing and eviction. Cache-aware routing piles an agent and its forked branches onto the few nodes holding the prefix, and P95 TTFT reaches 27 s. The load-balancing Dynamo router makes other nodes recompute prefixes, and P95 TTFT reaches 65 s. LRU evicts the KV of branches waiting for tools or sub-agents, and these evictions cause 39% of Dynamo's lost KV reuse.
The authors trace this to two roots: node role and KV location are coupled, so changing roles loses KV; and the planner, router, and eviction all rely on coarse signals such as queue depth, input length, and access time. The next three sections take these apart.
Any node can play either role, and KV lives in a shared pool
First, here is how one request flows through Evolving Infra.
| Step | Who | What | Output |
|---|---|---|---|
| 1 | harness | Tags each request with a branch ID; reports when a branch finishes | Requests labeled B1/B2 |
| 2 | router | Looks up the cluster-wide KV directory, predicts TTFT on each prefill node, picks the smallest | Target node, e.g. P2 |
| 3 | P2 | While the request queues, pulls B1's prefix from P1's host memory over RDMA and loads it into GPU | Fetch mostly overlaps the queueing |
| 4 | P2 → decode node | After prefill, hands KV to a decode node over GPU-to-GPU transfer | Generated output |
| 5 | planner | Re-evaluates the split every 600 s window; switches only if clearly better | New xPyD |
Two pieces separate role from KV. The symmetric engine extends SGLang with one scheduling loop that serves both phases, and its KV transfer works between any two nodes in either direction. When the planner changes a node's role, the router just changes which requests it sends there, and the engine does not restart. The shared KV pool joins the host memory of all nodes; every node writes KV to its own host memory as well as GPU memory.
Back to the example: when P1 becomes a decode node, the router first moves P1's queued requests to other prefill nodes, and P1 switches once its running requests finish. B1's 100K prefix stays in P1's host memory; the next B1 request lands on P2, and P2 pulls it from P1. Dynamo pays with downtime and Arrow pays with lost KV; moving KV out of node-local state avoids both.
Does fetching slow down prefill? HiCache (SGLang's tiered KV cache) loads KV into GPU layer by layer after prefill starts, so the load adds directly to prefill time. Evolving Infra instead fetches the whole KV and loads it into GPU while the request queues, so most of the fetch overlaps with queueing. The remaining host-to-GPU copy still counts in the prefill time model, and any part of a fetch that outlasts the wait still counts in the router's TTFT prediction.
Each KV block keeps a count of active branches still using it
Once KV can be read across nodes, the system still has to decide what to keep. The router maintains a cluster-wide KV directory: a prefix tree recording which node holds each KV block in GPU or host memory, plus a count for each block on each node of how many active branches reference it. Counts follow harness operations. On a fork or a new sub-agent, each block the new branch reuses gains 1; when a branch only appends content, only the newly appended blocks gain 1. When compaction rewrites a context, blocks dropped from the old context lose 1 and newly included blocks gain 1; when a branch finishes, all its counts are released.
In the example, the directory at this moment looks roughly like this (illustrative):
| KV block | Node | Branch still using it | Count | Last access |
|---|---|---|---|---|
| B1's 100K prefix | P1 | B1 (waiting for sub-agent) | 1 | 6 min ago |
| Copy of B1's prefix | P2 | B2 (sub-agent running) | 1 | just now |
| B3's 80K pre-compaction history | P3 | none | 0 | 12 s ago |
| B3's 5K summary | P3 | B3 | 1 | just now |
Eviction sorts by (count > 0, last access time) ascending: zero-count blocks go first, in LRU order among themselves, and referenced blocks are touched only after no zero-count block remains. The third row's key is (0, 12 s ago) and the first row's is (1, 6 min ago); 0 sorts before 1, so B3's old history goes first. Once B2 finishes and the harness reports it, the second row drops to zero and can be evicted too.
Why not let the router infer this from tokens? From prompt text alone, the router cannot tell whether B1 is waiting for its sub-agent or has finished and will send no more requests; only the harness knows. KV transfers also move counts. A transfer between two prefill nodes moves this branch's counts to the target, and the source releases them once the target holds the current version. The source copy drops to zero and becomes evictable only if no other branch still references it; a transfer between prefill and decode keeps counts on both sides, because the branch's next step needs both phases. Each active branch thus holds counts on at most one copy per phase.
With fast fetches and this eviction, the router no longer needs to pile requests onto nodes holding the prefix. For each prefill node it predicts TTFT: the remaining time of the current batch, plus the service time of each queued request, plus this request's service time, plus a charge for the part of the fetch that outlasts the wait and for the extra copy. In the example, later requests from B1 and B2 can go to different nodes instead of all landing on P1.
The planner sizes the split by average work, not short bursts
Choosing a split starts with estimating how much prefill and decode work a request needs. Why not use input length? Take an agent request with a 128K cached prefix and 8K new tokens (illustrative). By full length that is 136K tokens of prefill. In fact the linear layers process only the 8K uncached tokens, and attention computes 8K×128K + 8K×8K/2 query–key pairs, where the first term is 32 times the second. Counting full length treats the 128K cached prefix as tokens to recompute and overestimates prefill demand, which is how Arrow kept adding prefill nodes.
The paper's prefill iteration-time model therefore separates the two kinds of tokens: a fixed cost, plus linear-layer time per uncached token, plus attention time per query–key pair, plus time per token restored from host memory. Decode time is modeled from the number of running requests and the expected fraction of MoE experts selected. Both models' coefficients are fit online during warmup and then frozen, converging within a minute. On GB300, mean error outside the fitted settings is 4.2% for single requests and 6.3% for batches of 2–8 requests. This means a simple model that only separates cached from uncached tokens already has single-digit error.
Cluster throughput is set by the slower side: min(sum of prefill node throughputs, sum of decode node throughputs). Each node's throughput is 1 divided by the time one request occupies it. On a decode node, that time is one iteration's time multiplied by the output length, divided by the batch size and by the average number of tokens each iteration advances. On a prefill node, a request's occupancy time counts its own share of the work, a share of the iteration's fixed cost split by uncached tokens, and the time to restore its cached KV from host memory. This is evaluated at the window's average work per request; for decode nodes, the batch is the window's average number of requests in decode divided by the number of decode nodes. The planner uses average work rather than queue depth because several sub-agents starting at once only lengthen the queue briefly, while average work per request barely moves. Hoot says

All four steps use illustrative numbers; they only show the arithmetic.
Source
paper §5.1 Eqs. (2)(4): a request needs t_out/t_acc iterations, B requests share each iteration, occupancy T_iter(B)·t_out/(B·t_acc), μ_D = 1/occupancy; §5.2 Eq. (5): Θ = min(Σμ_P, Σμ_D), decode batch B = q̄/|D|Switching still costs something, so the planner also runs a significance test. The 600 s window is split into 10 slices; each slice measures average work and the average number of requests in decode, which go into the formula above to get the throughput difference between a candidate split and the current one. A candidate qualifies only if its mean gain exceeds twice its standard error. Illustrative: mean gain 0.3 req/s, standard deviation 0.5, standard error about 0.5/√10≈0.16, twice that about 0.32, which exceeds 0.3, so no switch. After each switch the planner also skips 120 s.
Switching drops from 754 s to 6.2 s
The experiments use 9 nodes of 4×GB300 (36 GPUs): GLM-5.2 runs Putnam and CC, and Kimi K2.6 runs OSWorld. Each run warms up for 30 minutes and is then measured for 1 hour at fixed concurrency, with a new agent started whenever one finishes. The Dynamo baseline starts from 6P3D, and all baselines get cache-aware routing, HiCache LRU, and the same deduplicated host memory.
| Setting | Baseline | Evolving Infra |
|---|---|---|
| Steady state, 3 workloads × 3 concurrency levels | Dynamo | Throughput 1.10–2.73×; lost KV reuse down 81–95%; mean E2E down 1.15–4.12× |
| Lowest concurrency of each workload | SGLang best static split | Throughput 0.98–1.38× |
| Single switch, mean over 9 settings | Dynamo restart 754 s | 6.2 s, node keeps serving |
| Load drifts from Putnam to OSWorld | Dynamo 83.1 s / static 5P4D 51.5 s | Mean E2E 38.7 s |
| CC 126 agents, fixed 4P5D, no split adaptation | Best static 4P5D, 4.57 req/s | 6.27 req/s |
| Same, split adaptation on | Same | 6.25 req/s |
The first three rows answer whether separation makes switching cheap: a switch drops from over ten minutes to a few seconds, and the KV is not lost. Lost KV reuse falls in relative terms; Dynamo itself loses only 1.85–7.78%, so this does not mean the hit rate rose by 81–95 percentage points.
The fourth row answers whether online split adaptation pays off when the load drifts: the split tracks the best split of each 10-minute window and settles at 8P1D in the OSWorld period. That is one prefill node more than the best split in the load-drift figure near the start, which was measured on SGLang; the authors attribute the gap to the symmetric engines shifting the best split. Mean E2E is 2.15× lower than Dynamo and 1.33× lower than static 5P4D.
The last two rows are an ablation on CC with 126 agents, starting from the best static 4P5D. Without split adaptation, the shared pool, asynchronous fetching, and count-based eviction plus routing give 1.37× the throughput of the best static split; turning on split adaptation lowers throughput by only 0.3%.
This means that when already at the best split, turning on online adaptation costs almost no throughput.
The authors also tested sensitivity to the initial split: CC with 126 agents, starting from four splits between 3P6D and 6P3D, mean E2E varies by at most 1.8%, and all four runs converge to 4P5D. This means the planner does not need someone to profile a good split first; the appendix estimates that offline profiling for one three-hour CC trace on 256 GPUs takes 10,752 GPU-hours.
Limits lie in TTFT, the harness, and the hardware
First, the planner optimizes throughput, not tail latency. On the decode-heavy Putnam it keeps only 1–2 prefill nodes, and at 224 and 288 agents its P95 TTFT is higher than Dynamo's.
Second, the counts need the harness to cooperate. In the example, if the harness never reports that B2 finished, the copy on P2 keeps a count of 1 and is not evicted early. The CC experiments replay recorded traces through a prefix tree, so output lengths and tool durations are the recorded values, not those of agents actually running.
Third, "KV capacity is not the bottleneck" has preconditions. The authors compared against ThunderAgent (which pauses agents waiting for tools); it never paused a single request and reached 0.95× the throughput of cache-aware routing, because the KV peak of active agents used only 86% of capacity. This relies on GB300's CPU–GPU interconnect, models like GLM-5.2 with very small per-token KV, and deduplicated host memory.
Back to P1: it switches from prefill to decode in a few seconds, and B1's 100K prefix stays in the pool; B3's old history has a count of 0 and is evicted first. The split can follow the load online because node role and KV location were separated first; which KV to keep is decided by whether an active branch still uses it.
How did this read for you?
Hoot made a note. Thanks for the feedback.

One tap, no sign-in; tap again to undo. Only anonymous counts are kept, never who you are.
Related papersMore from Paper Daily
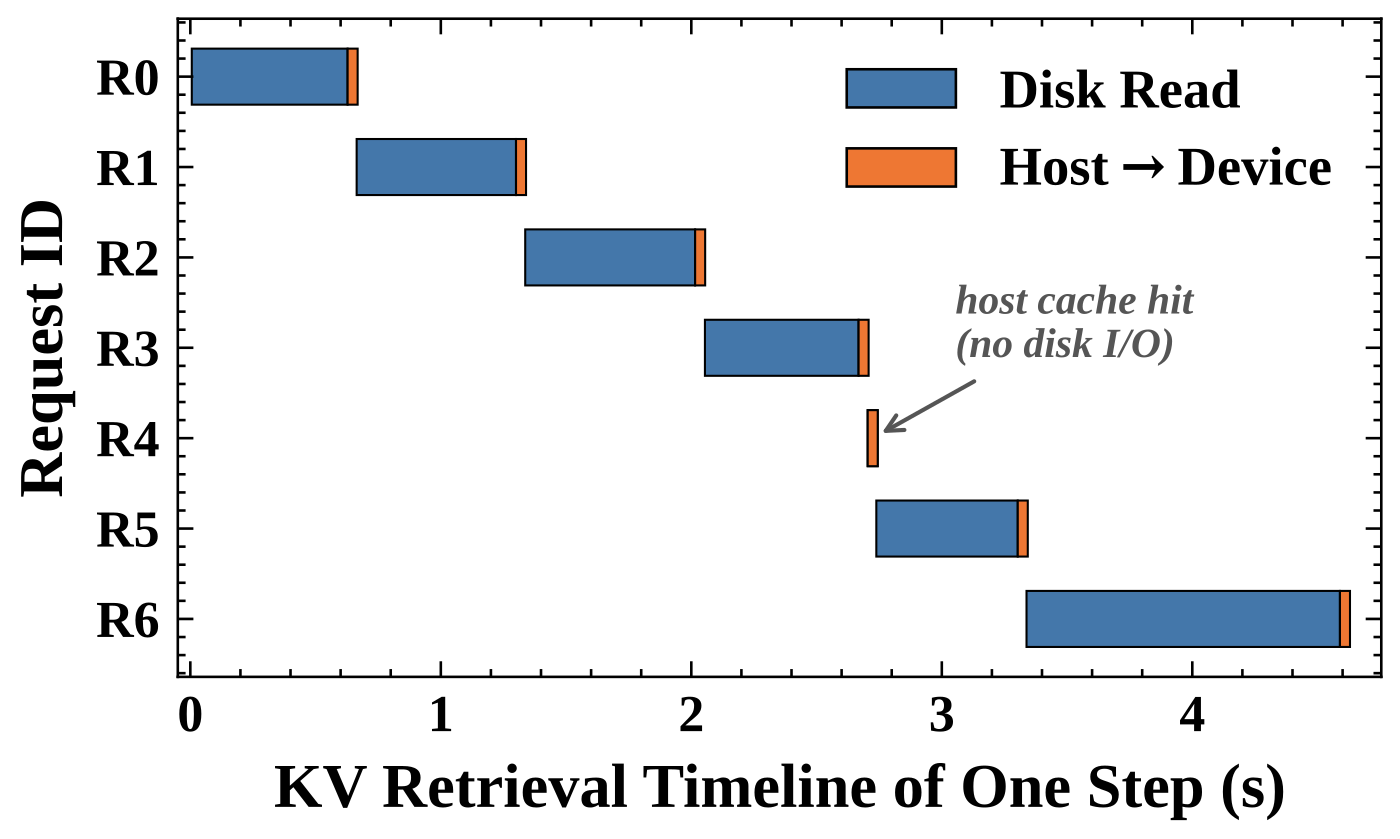 Infra · 2026-10-26KVStream: Adaptive Parallel Storage Management for KV Caching in Large-Scale LLM ServingLong-context inference keeps reusing the same prefixes: system prompts, whole documents, code repositories and multi-turn session histories. Their KV cache no longer fits in GPU memory or host memory, so it has to live on disk and be read back on the next hit, which puts disk reads on the critical path of every inference step. Existing systems read only from the node-local NVMe, while the paralle…
 Infra · 2026-11-12Bursts That Outlast Themselves: Persistent Degradation in Prefix-Cached Agent ServingServing agents depends on the prefix cache: on a hit each turn only computes the newly added content, and on a miss the whole context of tens of thousands of tokens is recomputed. The authors find that this can drop a server into a bad state it cannot leave. With the same base traffic, a few extra minutes of burst arrivals push the vLLM cache hit ratio down to about 10%, throughput halves, and th…
 Infra · 2026-11-10Inside the Trap: A Renewal Law for Prefix-Cache Collapse in LLM Agent ServingMulti-turn LLM agents rely on prefix caching to skip repeated work, but this paper finds a trap. After a sudden burst of sessions, an engine can fall into a state where every turn misses the cache and the backlog never drains, even at a load it handled before. In paired tests on two serving engines, two GPUs and two models, a burst of 200 sessions left the engine stuck to the end in all 30 runs,…
 Infra · 2026-11-04When Cache Pressure Becomes a Trap: Metastability in Agent ServingA ten-minute traffic surge can leave an agent serving engine with prefill and decode disaggregated unable to recover. After the surge ends and traffic returns to a level the engine handled before, goodput on SGLang stays about 88% lower over the following hour, and utilization and queue length give almost no warning beforehand. Behind it is a loop: too little cache causes recomputation, calls slo…
 Infra · 2026-11-11RecoGEM: A Serving System for Production-Scale Generative RecommendationGenerative recommendation has the model generate an item's SID token by token like an LLM, so LLM serving stacks look reusable, yet they run poorly because they assume every step has the same shape and attention cost sits in long sequences. This Kuaishou paper on RecoGEM spells out the difference: each candidate reads only a few SID tokens, but beam expansion creates a huge number of independent…
Discussion
Add experiment details, reproduction notes or a different take. Requires a GitHub sign-in.
Loading the discussion…