Contents · 7 sections
1How the engine falls into the trap2Reducing the trap to a queueing model3Why the trapped engine completes sessions faster4Does the theory match the real engine?5Two exits: refuse traffic, or limit sessions6The limitations I see7What it means for serving teamsSHARE

A tool-calling LLM agent sends the serving engine a new prompt after every tool call: the full previous context plus the tool's output. When the previous turn's KV cache is still in the prefix cache (a hit), the next turn only prefills the new part. In this paper's workload a hit prefills 551 tokens and a miss about 11,100. On SGLang with one A100, the authors saw a burst of 200 sessions push the engine into a trap: every turn misses and the queue keeps growing, at a load the engine carried without trouble when there was no burst. The counterintuitive part is getting out. At an arrival rate of 1.65 ( is the session throughput measured with prefix caching turned off; every rate below is a multiple of it), the trapped engine was still completing sessions at 1.21–1.70 in the 10 minutes before a cut. Intuition says that cutting arrivals below that rate should make the backlog fall. The authors cut arrivals to 1.15 ; the backlog rose in two of three runs and fell slightly in one, and all three were still at zero hits at the end. The paper's explanation: the completion rate seen in the trap is high mainly because the turns being served are mostly the first few turns of new sessions, with short, cheap prompts, and some short sessions finish there. In the authors' idealized model, the rate below which the queue actually drains is the capacity when every turn misses, about 1 , clearly below the throughput seen in the trap. The other exit is to limit how many sessions are inside the engine at once: this rescued all 9 established traps, with the arrival rate unchanged and no session refused.
How the engine falls into the trap
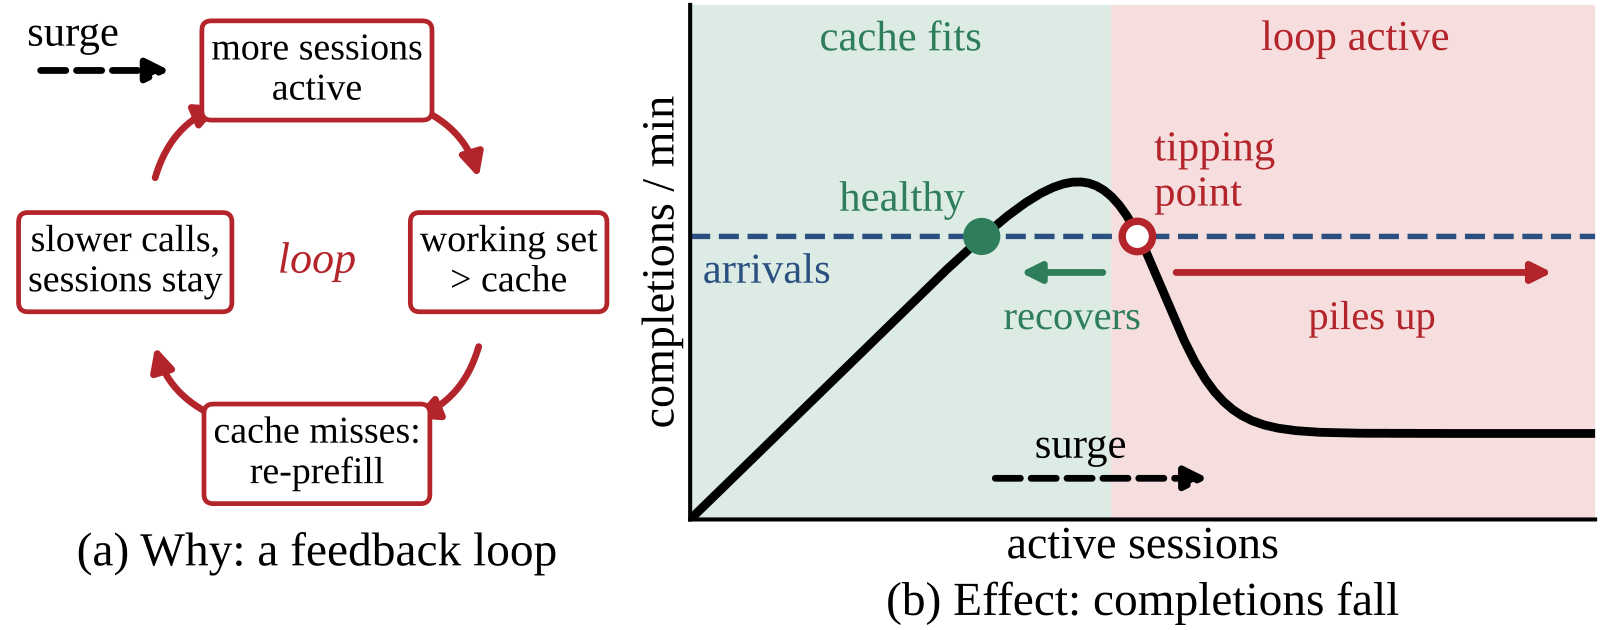
First, how the trap forms. Between turns an agent session waits for its tool to return (5 s on average in the experiments), and meanwhile its KV cache sits idle in the memory pool. To admit queued requests the engine has to make room, and idle KV is evicted by LRU. Under normal load the session comes back quickly, its KV is still there, and the turn hits. After 200 sessions arrive at once, the queue lengthens, the gap between a session's turns lengthens with it, and by the time the session returns its KV has been overwritten by other requests, so the whole prompt has to be prefilled again. Re-prefilling is more expensive, so the queue grows, the gaps grow, hits fall further: a self-reinforcing loop. In the paper's workload, a session's total prefill when every turn misses is about 16 times that when every follow-up turn hits.
To control conditions precisely, the workload is synthetic: each session's turn count follows a geometric distribution truncated at 60, with a mean of 14.76 turns; turn sends a prompt of tokens, the previous prompt plus 100 generated tokens and 550 tool-output tokens; tokens are random ids, so sessions share no prefixes. The KV pool is capped at 300k tokens. The authors ran paired experiments on SGLang and vLLM, A100 and H200, Qwen2.5-7B and Llama-3.1-8B: the same arrival sequence runs under three arms, one injecting 200 sessions at 1200 s (all within 60 s), one without the burst, and one with the burst but with a client-side limit on how many sessions enter the engine at once.
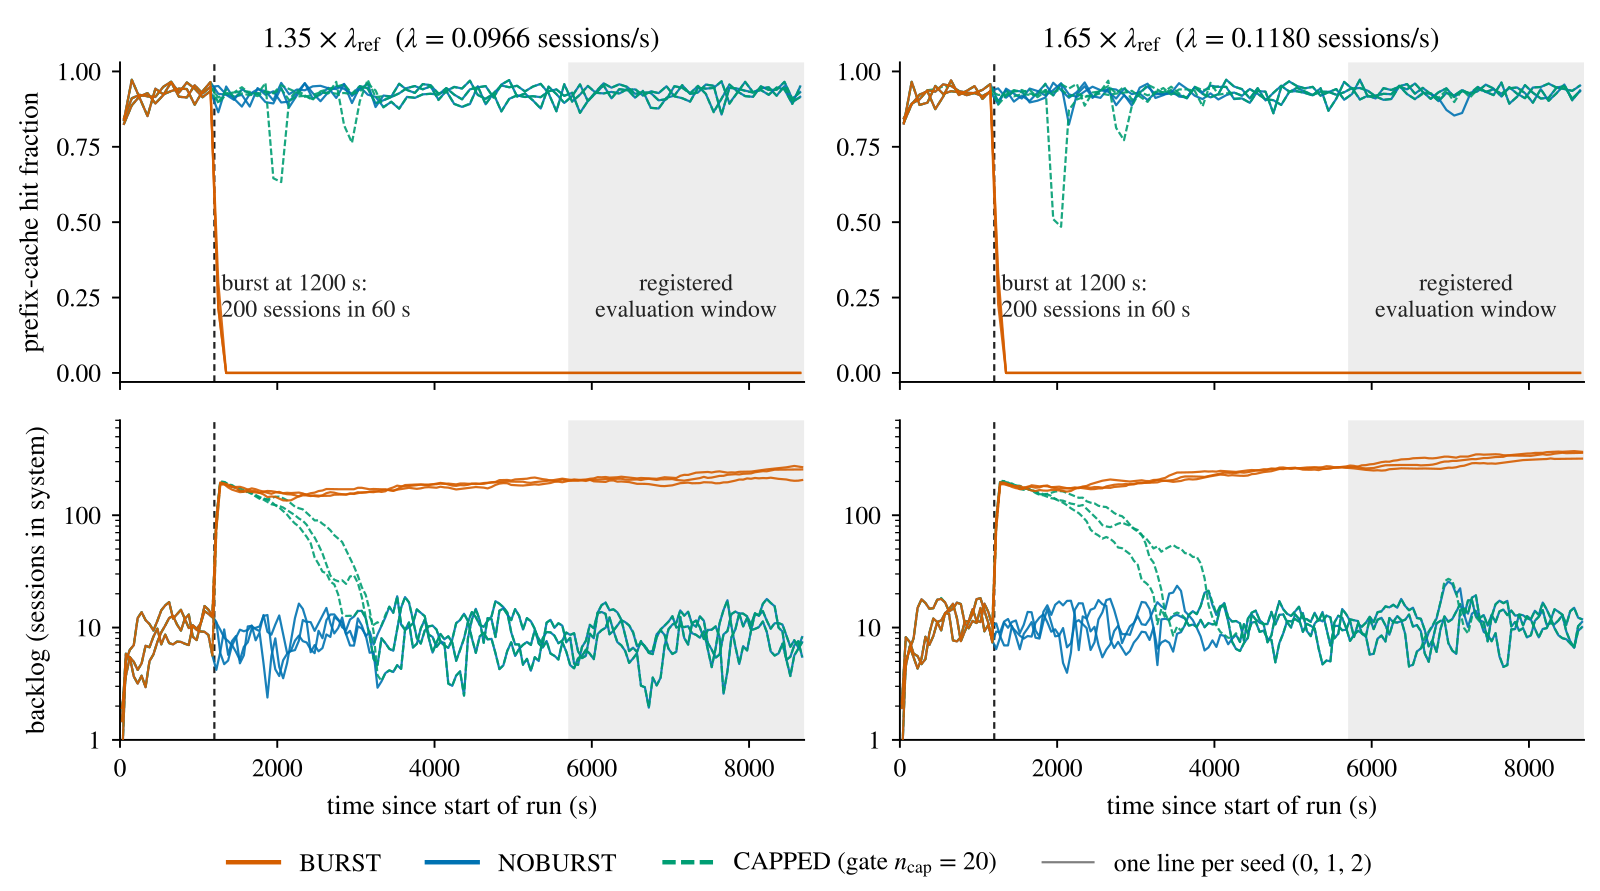
Across five paired experiments, all 30 burst runs stayed at zero hits from the burst to the end (7500 s); at the same arrival rates, all 30 no-burst runs stayed good throughout. This shows that the burst itself causes the trap, not a load beyond the engine's capacity. Burst size has a threshold: in every random seed, a 40-session burst stayed good and a 60-session burst got trapped. Under FCFS scheduling, once the trap forms it does not heal on its own (these counts are post hoc): over about 100 trapped hours, no 300 s window got back to a hit rate of 0.5; the highest was 0.16. In 16 runs the sessions that triggered the trap had all long left, and in 15 of them the turns completed afterwards still had no hit at all: the trap outlives the traffic that triggered it.
Reducing the trap to a queueing model
Earlier analyses treat this collapse as the falling branch of a throughput curve: the number of sessions in the system evolves as , where is the completion rate with sessions running; more sessions means fewer hits, so falls. Read literally, a trapped system completes sessions at the curve's low end (about the capacity when every turn misses), and the backlog grows at the arrival rate minus that capacity. In the authors' measurements both are wrong: trapped runs complete sessions faster than that capacity, and the backlog grows only about two thirds as fast as that prediction.
To pin down what the trapped state is, the authors idealize it as model F: a single-server FIFO queue in which every turn misses. Turn always costs seconds of GPU time (from a cost model fitted only to server-log timings). A finished turn rejoins the tail of the queue at once as the next turn, and new sessions arrive at rate . The 5 s tool wait is negligible against the 166–516 s gaps between turns in the trap.
Model F is a fluid model: arrivals and service are treated as continuous flows of work, a single request is too small to matter, and rate times time is an exact quantity. One key fact follows. A request that joins at time waits for all the work already in the queue, so it completes at , where is all the pending work in the queue at time . Because a session rejoins the tail as soon as it finishes a turn, the gap between two consecutive turns of a session is exactly the pending work in the queue at that moment.
One step further, start from any time : the request that joins at completes at , the request that joins at completes at , and so on; the interval between two consecutive times is a cycle. A session's next turn rejoins exactly at , but this sequence of times is set by first-in first-out alone and does not depend on any session still being alive. Because the queue is first-in first-out, the requests that join in are exactly the requests completed in . So the work in one cycle is the work that joined during the previous cycle, which is the sum, over sessions that arrived in earlier cycles and are still alive at turn , of the cost of their turn :
is the length of cycle , and is the number of new sessions that arrived cycles earlier. is the probability that a session has at least turns, and is the cost of turn . is the part contributed in cycle by the work already in the queue at the start, which drops to 0 after finitely many cycles. Intuitively, this has the same structure as the population recursion "births this year = sum over age groups of survivors × fertility", and the authors note it belongs to that class of renewal equations. Hoot says

All numbers are illustrative (one new session per second, turn 1 costs 0.6 s, half the sessions have a turn 2 costing 1 s, the two earlier cycles last 10 s each); the paper has no such example. The FIFO cycle construction and the recursion are from the text.
Source
paper's model F and the recursion along FIFO cycles Δn = Σk λ c_k G_k Δn−k + h_n; the example parameters are illustrative and the results are computed by hand from itThe recursion is linear, and its long-run behavior is set by one number: the positive root of . When the arrival rate exceeds the all-miss capacity (the denominator is a session's mean total cost when every turn misses; across the authors' configurations, is 0.96–1.035 ), , and the authors prove that from any trapped state the system converges to the same self-similar state:
- the gap between turns grows linearly in time, ;
- the number of backlogged sessions grows at rate , where is a session's turn count;
- sessions complete at rate ;
- the mix of turns being served tilts toward early turns: the share of turn is proportional to .
One way to read : each cycle is about times longer than the previous one. A session with turns must get through ever-longer cycles, and the authors prove that it completes at about times its arrival time (with time measured from a virtual origin). So sessions of this kind that arrive during some interval complete spread over an interval times longer, and their completion rate is diluted to of their arrival rate; averaging over the turn-count distribution gives . The more turns, the stronger the dilution.
Why does the trap not heal? While trapped, the engine writes new content into the KV pool at the all-miss rate, and the cumulative writes equal a whole pool every 26–78 s; in the burst runs of the first three paired experiments, the gap between turns was 4.1–9.7 times that. By the time a session returns its KV has long been overwritten, so the assumption that every turn misses sustains itself, and holds more firmly as the gaps keep growing. The authors state that this is a consistency argument, not part of the theorem.
Why the trapped engine completes sessions faster
Intuitively, a trapped engine should not complete sessions faster than its all-miss capacity. The authors split the completion rate into two factors:
depends only on the distribution of the turn count . For a geometric turn count, every turn has the same chance of being the last, and equals 1 exactly; truncation (for example at 60 turns) puts it slightly below 1. is the cost-growth factor: the mean cost per turn under the stationary mix (every turn of every session counted once, the mix behind ), divided by the mean cost per turn under the tilted mix of the trap. Later turns have longer, costlier prompts, and the trap serves mostly early turns, so . The authors call this effect the youth premium: the server spends its time on the cheap early turns of new sessions, some short sessions finish there, and long sessions are pushed ever further back, so completions exceed capacity while the backlog still diverges.
The effect is not automatic. When the turn count is nearly fixed, can fall far below 1 and outweigh , so completions drop below capacity. The authors used this for a test with predictions frozen in advance (MIRROR): they changed the sessions so that about 98% run exactly 20 turns (like agents with a fixed step budget). The model predicted that at 1.65 completions would nearly stop for about 40 minutes after the burst, because the injected sessions must get through 20 ever-longer cycles before finishing; then they complete in one wave, followed by a lull in which the completion rate is only about half the capacity. In the measurements all three seeds at both arrival rates followed this shape. At 1.65, for example: first 0.06–0.09 , a wave of completions at 4945–5089 s, then 0.50–0.61 over 6600–8700 s, below the measured capacity of 1.06. This window measures the lull after the wave; the model's long-run completion rate is 0.81. The authors also picked this workload with the model's predictions in hand. What it rejects is the throughput-curve readings, which predict completions steady near 1.05 and no wave.
Does the theory match the real engine?
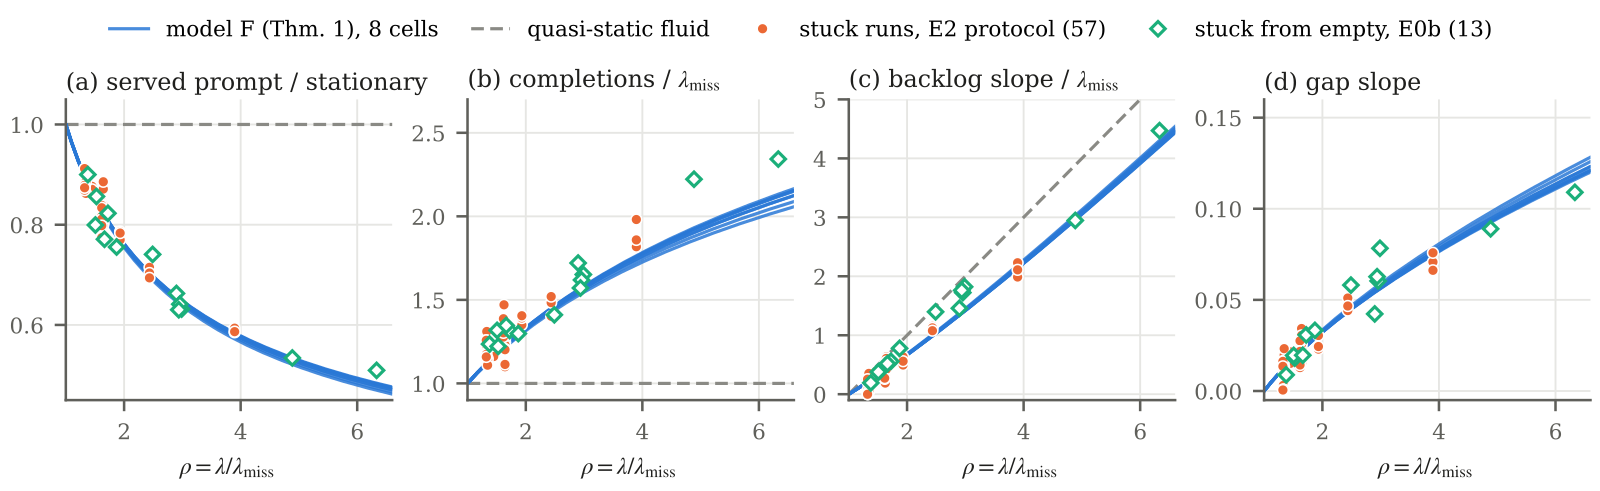
The authors compare model F against 57 trapped runs (SGLang and vLLM, two GPUs, two models) with no parameter fitted to any measurement taken in the trap; vLLM, the H200 and Llama each get only one speed factor, fitted to their own all-miss token rate. Note that the theory was derived after these runs had been read, so this part is a retrospective check. "Stationary" in the table means the stationary turn mix defined above.
| Quantity | Model F predicts | Measured over 57 trapped runs | Throughput-curve reading |
|---|---|---|---|
| Mean prompt of served turns | 10–42% shorter than stationary | 9–41% shorter; within 3% in 50 runs | Same as stationary |
| Session completion rate | Above the all-miss capacity | Above in every run, at 1.10–2.03× | Equal to capacity |
| Backlog growth ÷ model F's | 1 | Mean 0.99, median 1.06 | 1.36–1.59 |
| Growth slope of the gap between turns, measured ÷ predicted | 1 | Median 1.01, per run 0.04–1.81 | None |
These numbers show that model F describes "what the trap is serving" and "how fast the backlog grows" much more accurately than the throughput-curve reading. Part of the extra completion rate comes from the engine computing prompt tokens faster under congestion; after the authors divide out each run's measured token-rate ratio, completions are still 1.08–1.81 times , in all 57 runs. Individual runs scatter widely, mostly with the actual number of arrivals in that run's arrival sequence.
For several more tests, the predictions were frozen before the runs started. With no burst, slowing every tool call that starts in 1200–3000 s by 30 s trapped all three runs, while earlier no-slowdown runs on the same arrival sequences stayed good; another experiment with a 15 s slowdown trapped one of three runs. Pooling these four runs trapped by a tool slowdown alone and comparing them with the frozen model predictions, the served mix, gap slope, completion rate and backlog slope all fall within tolerances set in advance (for example ±5% for the served mix and ±35% for the backlog slope). One further check, which estimates each run's backlog slope from its actual arrivals, failed in two runs. The tolerances of these tests were set on earlier runs, so they are blind only in the sense that the outcomes were unknown.
Two exits: refuse traffic, or limit sessions
An operator who sees a trapped engine still completing sessions at some rate will naturally cut arrivals below that rate. Model F says this is not enough. As long as the completion rate is above (true for the authors' standard workload at every arrival rate they checked, but not for the fixed-turn MIRROR workload), cutting arrivals to anywhere between and never empties the queue. Only a cut below drains it, and the closer to , the slower. In the model's numbers: at 1.65 , ; a cut to makes the backlog dip by only 0.3% and then grow again; a cut to takes about 15 hours to drain.
The engine test (CUT) injects a burst at 1.65 and cuts arrivals at 2400 s, with model F's per-seed predictions frozen in advance. A cut to 1.15 (realized 1.12–1.20) is below the trapped throughput of the same seeds' uncut runs, 1.32–1.41. If the engine kept completing at that throughput, the backlog slopes would be −0.0094 to −0.0204 sessions/s; the measured slopes were +0.0040, −0.0022 and +0.0029, against model F's +0.0039, −0.0026 and +0.0028, and all three runs stayed at zero hits to the end. A cut to 0.85 (realized 0.81–0.88): the backlog fell slowly, and at 8700 s all three runs were still trapped with 140, 77 and 89 sessions, against model predictions of 139, 79 and 94. The authors also state the test's limits. "Did not get out" means within 8700 s, and the decision rule was fixed after the predictions were read. In the 1.15 arm, intermediate readings such as "constant completions at the cut arrival rate" fit as well as model F, and the evidence that singles out model F is post hoc analysis. The cut comes 1200 s after the burst, so it probes a young trap, not the long-run state.
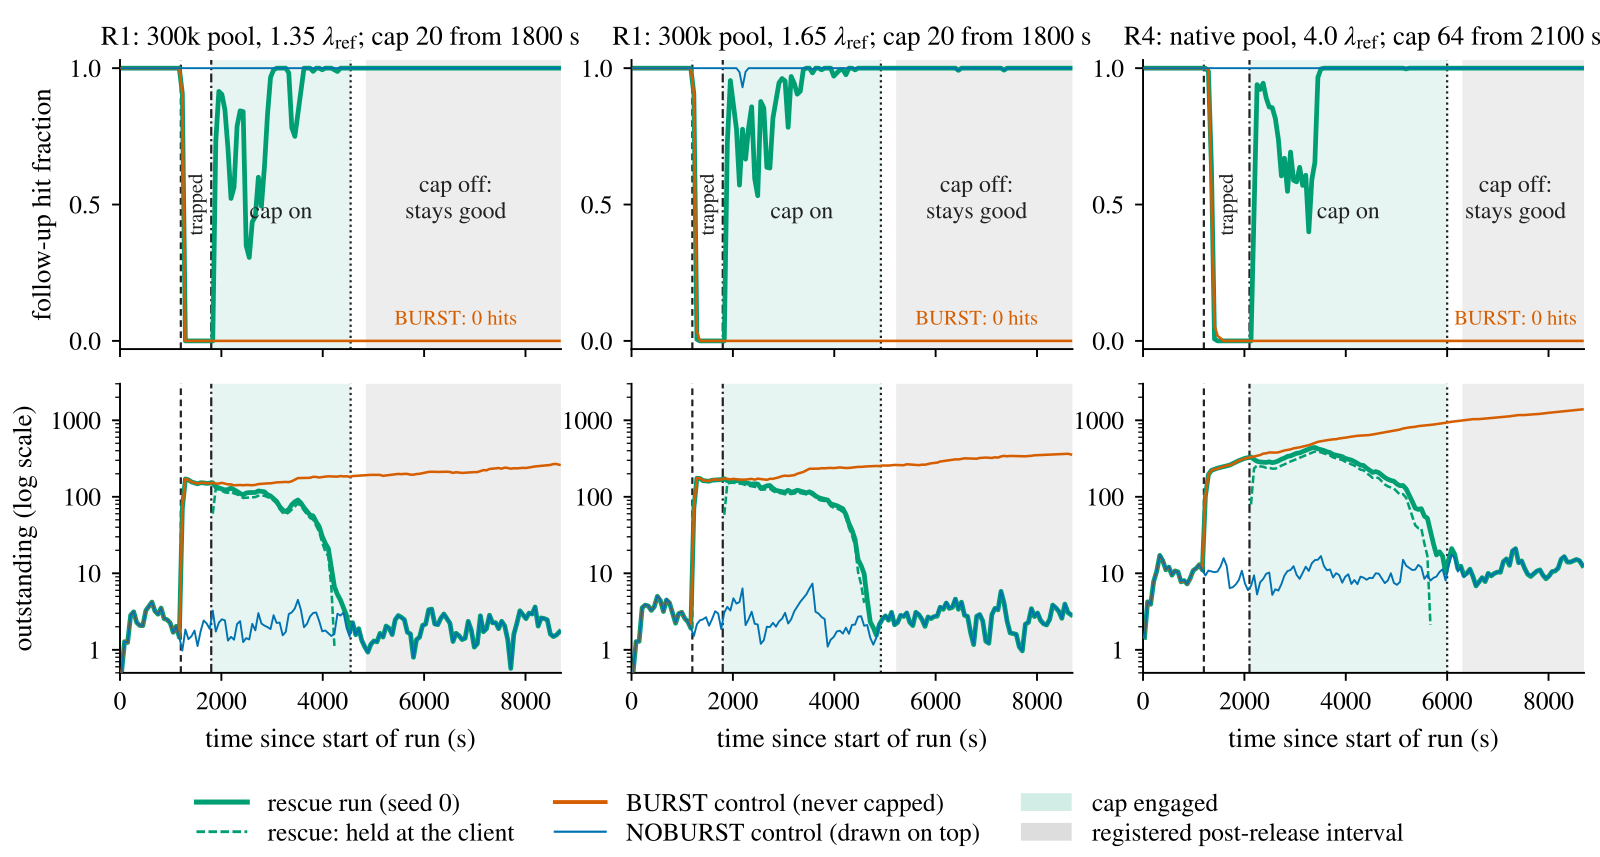
The first exit is to stop accepting traffic. At 1.35, arrivals were stopped from 1800 s: a 600 s stop refused 56–59 sessions and left the runs trapped; a 3600 s stop refused 355–378 sessions before the runs recovered. Starving the trap works, but at the price of hundreds of refused sessions.
The second exit is to make turns hit again, that is, to leave model F's premise. The mechanism is a FIFO gate: at most sessions are admitted to the engine at once, each holds its slot until its last turn ends, and the rest wait at the client. When engaged midway through a trap, with more sessions in the engine than the cap, the gate tightens by attrition: when one of a session's tool calls ends while more sessions than the cap are admitted, it gives up its slot and joins a resume queue; the resume queue is served before new arrivals, each in arrival order. The cap is the smallest session count at which the throughput curve reaches 95% of its peak (20 for the 300k pool). Few enough sessions are then in the engine for their KV to fit, so turns hit again; queueing moves from "every turn misses inside the engine" to "waiting for a slot at the client". In the pre-registered rescue tests, the cap was engaged 600–900 s after the burst (at 1800 s for the 300k pool, 2100 s for the native pool), inside established traps (hit rate 0.000–0.002 over the preceding 300 s); all 9 runs were rescued with the arrival rate unchanged and no session refused. Hits came back within three minutes and the backlog drained; the cap was removed once the client queue had been empty for 300 s, and the runs stayed good afterwards, indistinguishable from the no-burst controls. The price is waiting at the client: 386–569 s per paused session on average. Goodput counts sessions completed per hour that meet the target, a session meeting it if its elapsed time is at most 4 times an unloaded reference (computed post hoc, dropping the original definition's per-token latency condition); against the same-seed no-burst run, sessions arriving in the hour after the burst still lost 45–97% of goodput.
The limitations I see
First, model F describes only the inside of the trap, not the transitions into and out of it. On the real engine about 28 requests run concurrently with the 300k pool, vLLM preempts, and hits return as the backlog falls; the authors do not prove that the engine converges to model F. The 57-run comparison is retrospective, and its scoring tolerances were set on those runs; the blind tests are only the 4 tool-slowdown runs, the 6 CUT runs and MIRROR, all on the A100 with the 300k pool.
Second, the workload is some distance from real agents: random tokens, no shared prefixes between sessions, tool times drawn from an exponential distribution with a 5 s mean, clients that never retry or give up, and dense 7–8B models on a single GPU. The real agent traces the authors cite have shorter and more dispersed tool times; serving with prefill and decode on separate machines, KV offloading and larger models are untested. Concurrently, Lu et al. observed the same collapse on SGLang with prefill and decode deployed separately, but there the trapped hit rate is about 0.3, not zero, so model F's conclusions do not carry over directly.
Third, in the rescue tests the cap was engaged at a fixed time, not triggered by an online signal. In the vLLM paired experiment the authors froze a detector based on a hit-rate threshold in advance, and it alarmed in two capped runs with no trap; the paper does not yet give a validated rule for when to engage the cap. Also, SGLang's longest-prefix-match scheduling (LPM), which does not queue by FCFS while at most 128 requests wait, escaped on its own in 4 of 9 trapped runs, so the conclusions mainly concern FCFS scheduling.
What it means for serving teams
If you serve multi-turn, tool-calling agents, the paper gives three reminders you can use directly.
- Treat "session throughput with prefix caching turned off" as a capacity number worth measuring. In model F it, not the completion rate on the dashboard during a trap, is the recovery threshold; a rate limit set from the latter will likely not get you out. Even below it, draining takes hours, so the practical exit is a session limit.
- Limiting the number of sessions admitted to the engine is the exit that refuses no sessions. The limit can be taken from the throughput curve as in the paper (the smallest session count reaching 95% of peak completions); first reproduce the chain "burst → zero hits → cap → recovery" in a load test.
- To judge whether the engine is trapped, do not look at the session completion rate. The paper's rule checks whether the uncached prefill token rate is close to the rate with caching off; I suggest monitoring it together with the follow-up hit rate and the gap between a session's turns.
| Dimension | Assessment |
|---|---|
| Importance of the problem | High. Under agent workloads a burst alone can wipe out the benefit of prefix caching, and it does not heal on its own |
| Novelty of the method | Medium-high. The self-similar state and the renewal equation are known mathematics; new are deriving the recursion along FIFO orbits, proving that every trapped state converges to it, and splitting the completion rate into two factors |
| Experimental evidence | Medium-high. Registered paired experiments cover two engines, two GPUs and two models; the theory checks are mostly retrospective, and the blind tests use a single configuration |
| Engineering cost | Low. A session cap is admission control at the client or gateway, with no engine changes |
| Worth trying? | Yes. First measure the cache-off session throughput and the session cap in a load test, then decide the rate-limit thresholds |
A trapped engine looks like it is still completing sessions fast mainly because the turns it serves lean toward the first few turns of new sessions; that number cannot be used to set the recovery threshold.
How did this read for you?
Hoot made a note. Thanks for the feedback.

One tap, no sign-in; tap again to undo. Only anonymous counts are kept, never who you are.
Related papersMore from Paper Daily
 Infra · 2026-11-04When Cache Pressure Becomes a Trap: Metastability in Agent ServingA ten-minute traffic surge can leave an agent serving engine with prefill and decode disaggregated unable to recover. After the surge ends and traffic returns to a level the engine handled before, goodput on SGLang stays about 88% lower over the following hour, and utilization and queue length give almost no warning beforehand. Behind it is a loop: too little cache causes recomputation, calls slo…
 Infra · 2026-11-03HiState: Hierarchical Prefix Cache Management for Hybrid LLM Serving in Agentic WorkloadsThe recurrent layers of a hybrid model compress the whole prefix into a fixed-size snapshot, and it cannot be cut back to an earlier position. So even when the KV is still cached, if the snapshot at the match point was never saved or has already been evicted, a long stretch must be recomputed from an earlier snapshot, or from scratch. HiState exploits an asymmetry: a cache hit reads every matchin…
 Infra · 2026-11-12Bursts That Outlast Themselves: Persistent Degradation in Prefix-Cached Agent ServingServing agents depends on the prefix cache: on a hit each turn only computes the newly added content, and on a miss the whole context of tens of thousands of tokens is recomputed. The authors find that this can drop a server into a bad state it cannot leave. With the same base traffic, a few extra minutes of burst arrivals push the vLLM cache hit ratio down to about 10%, throughput halves, and th…
 Infra · 2026-11-04Rethinking KV Cache Eviction for Agentic LLM ServingWhen the KV cache runs out of room, vLLM and SGLang both evict from the end of cached sequences, to keep the opening prefix that many requests can share. But an agent sends its long history back every turn, and later tokens cost more to recompute, because each attends to every token before it. Penelope does the opposite: it still keeps the shared prefix, but evicts the rest of the history from th…
 Infra · 2026-11-13Evolving Infra: Agent-Adaptive LLM Serving at ScaleAgent workloads pose two problems for inference clusters. Some agents are prefill-heavy and others decode-heavy, and the mix drifts over time, so any fixed ratio of prefill to decode nodes loses out in some periods. Context compaction and sub-agents also change which KV is worth keeping: when a sub-agent returns after several minutes, almost the whole prompt can reuse earlier KV, while a request…
Discussion
Add experiment details, reproduction notes or a different take. Requires a GitHub sign-in.
Loading the discussion…