 CIKM 2026 Workshop
Contents · 8 sections
1The same model on search: swapping by filter raised bookings, ignoring filters did not2A photo takes six steps to become a cover3Photos nobody has clicked enter the candidates through five substitute signals4The most attractive photo must first pass compliance and representativeness checks5The CTR model learns which of two photos has the higher click rate6When a guest ticks "pool", only pool photos are eligible7Why keep 10% random exploration online instead of Thompson Sampling8Two things OptiCover does not do yetSHARE

For Airbnb's automatic cover-photo swapping, getting more bookings depends more on controlling which photos may become covers and which searches trigger a swap than on pushing click-through rate higher.
A listing on Airbnb usually has dozens of photos, and the host picks one by hand as the cover. That cover appears everywhere, on the home page, on search results and elsewhere, no matter what the guest searches for. One example runs through this piece (illustrative): a lakeside cabin has 12 photos; the host chose the living-room sofa as the cover, and also shot the backyard pool, a bedroom, and a small tavern a 5-minute walk away. A guest on the search page ticks the "pool" filter, and when the cabin appears, the cover is still the sofa; the pool is only visible after opening the listing page.
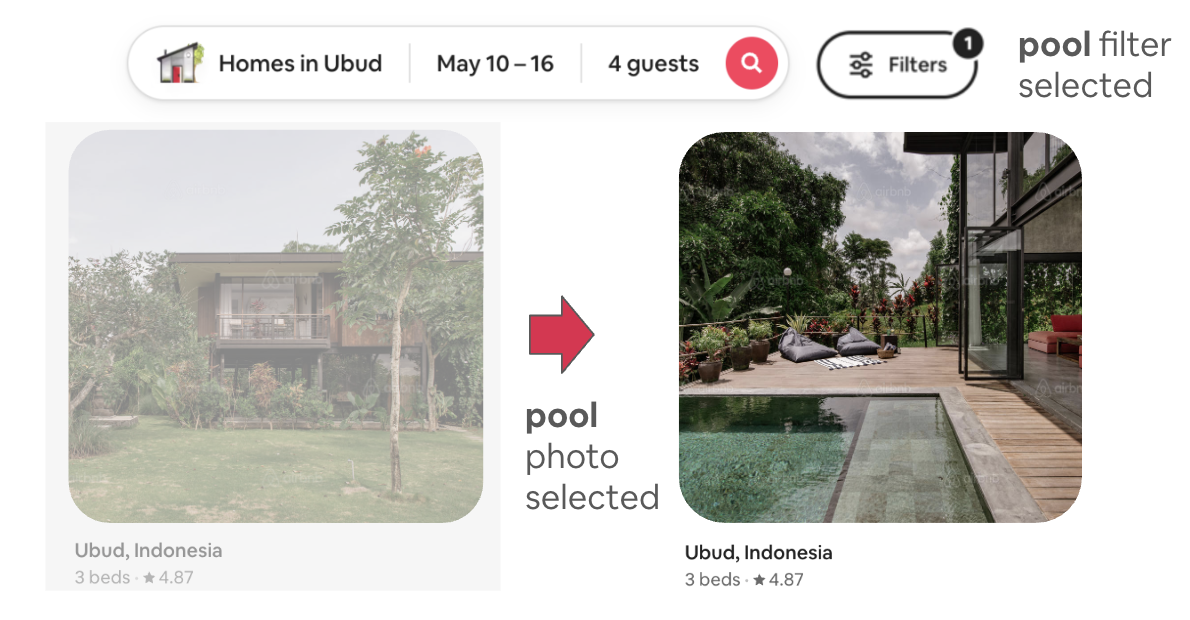
Letting a machine pick covers for hosts runs into a first problem: there is no data. Over 90% of Airbnb listing photos have never been a cover, so they have no cover click records, and hundreds of thousands of new photos arrive every day. For the cabin, only the current sofa and the bedroom that was the cover last year have click records among the 12 photos; the other 10 have never been clicked by a guest (illustrative). The second problem is that a high-click photo is not necessarily usable. The tavern might be the most attractive, but a guest who arrives and finds the tavern is not part of the house has a worse stay. The third problem is that the same photo is worth different things in different places: the sofa may do on the home page, but it cannot answer what a guest who ticked "pool" most wants to check, namely what the pool looks like.
Existing approaches are stuck on getting clean data. The first fits historical CTR (click-through rate) with logistic regression, putting observable factors into covariates. The cabin's sofa cover may get a high click rate simply because the host replies fast and has good reviews, and these unobserved factors are credited to the photo (illustrative). The second looks at the change before and after a host switches covers, but hosts often change the price or description at the same time. If the cabin switched its cover to the pool in July while cutting its price, a rise in clicks cannot be attributed to the photo, the price cut, or the summer holidays (illustrative). Online methods such as Thompson Sampling learn while trying, but those 10 photos must each collect enough impressions, and the tavern photo might also be chosen during the trial.
OptiCover is Airbnb's production cover-selection system, which the authors say swaps tens of millions of covers per day. It first uses several substitute signals other than clicks (human review results, covers the host used before and others) to narrow photos with no click records down to a set of reliable candidates, then decides which candidates are eligible based on the guest's search conditions. The click-rate model comes after these two steps and only ranks candidates that already qualify.
The same model on search: swapping by filter raised bookings, ignoring filters did not
The authors ran three A/B tests, randomized by visitor. The control group always sees the host's current cover, and the treatment group sees the photo OptiCover picks. The CTR model in all three was trained only on home-page data, collected over 5 weeks of online exploration (randomly swapping photos online and logging clicks, covered later).
| Experiment | How the treatment swaps covers | Duration and visitors | CTR change | Bookers change |
|---|---|---|---|---|
| Home page | Swap to the eligible photo with the highest predicted CTR | 3 weeks, about 10 million | +1.5% [1.3%, 1.8%] | n/a |
| Search, ignoring search conditions | Swap to the eligible photo with the highest predicted CTR | 2 weeks, about 10 million | +0.32% [0.16%, 0.48%] | +0.075% [-0.14%, 0.29%] |
| Search, swapping by filter | Only under 7 filters, choosing from photos that match the intent | 6 weeks, about 1 million | +0.14% [-0.24%, 0.52%] | +0.35% [0.01%, 0.69%] |
All changes are relative percentages of the treatment group versus the control group, and the brackets are 95% confidence intervals. The home-page experiment tested clicks, so its bookers cell is empty. Home-page CTR rose by 1.5%, which shows that once photos mostly without click records were admitted as candidates, the covers the model chose really did get more clicks than the hosts' choices.
The first search experiment moved the home-page model over unchanged and, whatever the guest searched for, swapped in the eligible photo the model scored highest. CTR rose by 0.32% with an interval excluding 0, but the interval for bookers crossed 0. The extra clicks did not become a measurable increase in bookings. The paper says analysis indicated that the extra clicks mainly moved bookings between listings, but gives no data for that analysis. Illustration: of 1,000 visitors, 100 would book anyway; after the swap, the cabin gets 2 more bookings and a neighboring listing 2 fewer, and the number of bookers is still 100.
The second experiment first narrowed candidates by search intent, applying only under 7 filters chosen by the product team: pool, hot tub, kitchen, waterfront, lakefront, ski-in/ski-out and indoor fireplace. When a guest ticks "pool", only the cabin's photos with a pool are eligible. In this group the CTR change was not significant, yet bookers rose by 0.35%. So the same model used a different way changed the booking result, and the authors conclude that narrowing the candidate range may matter more for bookings than simply chasing CTR.
The same model, with only the range of eligible photos changed, no longer raised click rate significantly, yet raised bookers significantly.
The precision of this conclusion is limited. The filter-based experiment had only about 1 million visitors, its interval's lower bound of 0.01% barely excludes 0, and the two search experiments differ in duration and size. I read it as directional evidence: that swapping by filter raises bookers has statistical support, but the true lift could be close to 0 or as high as 0.69%. The experiment also shows in passing that a model trained on home-page data can be used on the search page first, without waiting for the search page to collect its own data.
A photo takes six steps to become a cover
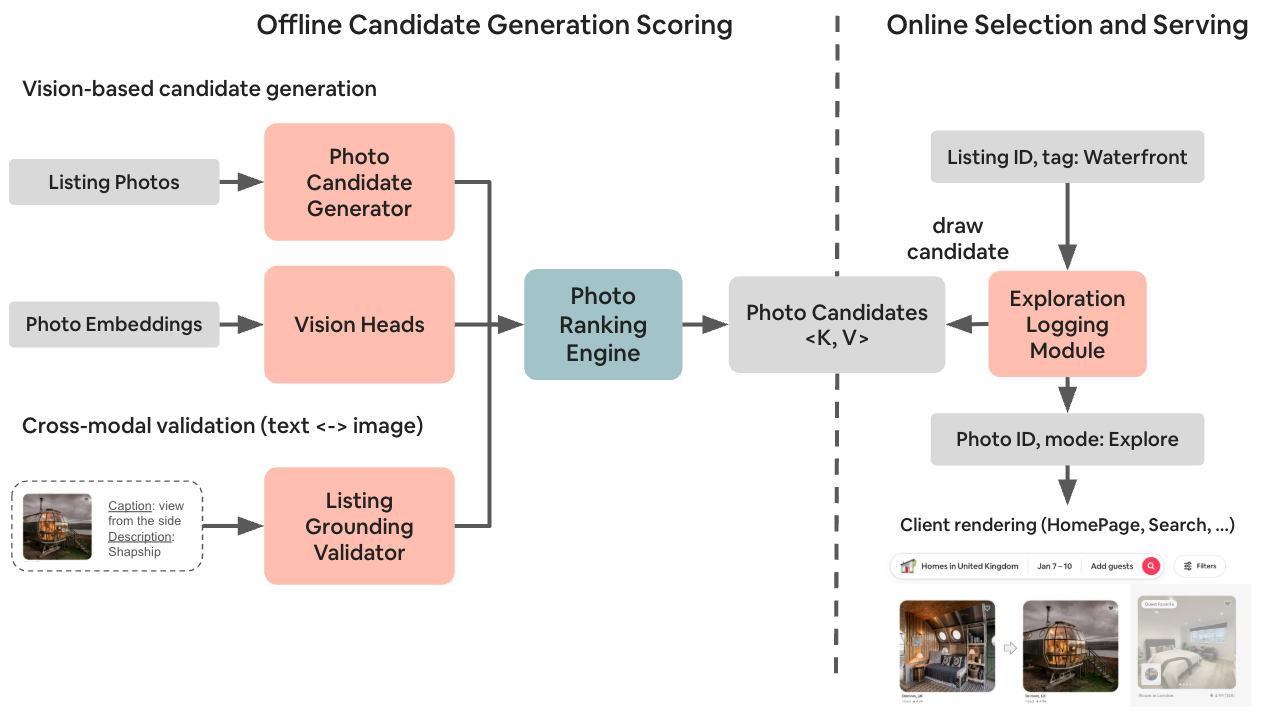
"Only letting pool photos be chosen" was possible in the experiment because the system had already turned each listing's photos into labeled candidate lists. The table below is the full path of one photo.
| Step | Input | Operation | Output | Where |
|---|---|---|---|---|
| 1 Candidate generation | All of a listing's photos | Five substitute signals pick photos that may work as covers | Candidate pool | Offline |
| 2 Quality filtering | Candidates' image embeddings | Small classifiers remove noncompliant photos with watermarks, faces, certain room types and so on | Compliant candidates | Offline |
| 3 Representativeness check | Higher-risk candidates, captions, listing description | A large model judges whether the photo represents this listing | Pass or reject, with a reason | Offline |
| 4 Labeling and ranking | Passing candidates, page, filter | Adds labels such as pool, keeps only photos matching the intent, ranks by calibrated predicted CTR | k candidates per listing per context | Offline, written daily to a Key Value store looked up by listing |
| 5 Online selection | The list from step 4 | 90% of impressions go to the top photo, 10% are uniformly random among the k | The cover, plus impression and click logs | Online |
| 6 Retraining | Logs from step 5 | Turns logs into photo pairs and trains the CTR model | A new model | Training only |
The first three steps decide eligibility, step four ranks by context, step five shows covers to guests and logs clicks, and step six retrains the model on those logs. The cabin's tavern photo is rejected at step 3, and the pool photo goes all the way to step 4 and gets the pool label.
Photos nobody has clicked enter the candidates through five substitute signals
All 12 photos could go into the candidates, but then the tavern and blurry photos would get in too, and more exploration impressions would be needed. The authors instead borrow signals other than clicks to pick out photos that may work first.
The cabin's current sofa cover is naturally included. When Airbnb built its Categories home page years ago, a model first sorted photos into categories such as Lakefront and Amazing Pools, and people then judged whether each could be that category's cover; these human judgments can be reused directly, for example for the cabin's pool photo. Covers the host used in the past also count, for example the bedroom photo the cabin used last year. Photos semantically similar to already reviewed photos can also come in, for example another pool photo taken at night.
The fifth source is called Opportunistic and picks by "CTR lift predicted by the CTR model × weekly traffic" (the CTR model can score photos with no click records, covered later). Illustration: photo A has a predicted CTR lift of 0.2 percentage points and its listing gets 1,000 impressions a week, giving 2 extra clicks a week. Photo B has a predicted lift of 0.5 percentage points but its listing gets only 100 impressions a week, giving 0.5 extra clicks a week. B's lift per photo is larger, yet this source still picks A first, because it looks at the total gain in clicks.
To see how much a wider candidate range can gain, the authors computed an upper bound: start with only the host's current cover, add sources one at a time, and take for each listing the CTR of the best-performing photo in its eligible range. Normalized, this best CTR goes 1.00, 1.10, 1.23, 1.34, 1.38, while the total number of photos grows to 1.51 times. More candidates raise the reachable CTR ceiling, and every added source raises it further. This is the ideal value if every listing picked its best photo; the home-page experiment actually got +1.5%, and the two numbers are not on the same basis.
The most attractive photo must first pass compliance and representativeness checks
The candidates still include noncompliant photos, so the first gate is a cheap check. Airbnb has nearly 1 billion listing photos, and fine-tuning a ViT for each task is too expensive. The authors have all tasks share one frozen SigLIP-2 embedding (SigLIP-2 is a pretrained vision model in the CLIP family, and its parameters are not updated here). Each task adds only a shallow MLP on top, a small classifier the paper calls a vision head. Illustration: each of the cabin's 12 photos is embedded once, and the watermark, face, room-type and amenity checks all read that same embedding instead of running a ViT four times.
Compared with CLIP zero-shot classification, macro F1 rises from 0.54 to 0.96 on the room-type task and from 0.65 to 0.90 on the amenity task. A small classifier on a frozen embedding does much better than zero-shot classification, so these tasks do not each need their own vision model.
But a vision head only reads the photo itself. On its own, the tavern photo shows an attractive building, and a pure vision classifier may not know it is not part of the cabin. Only the host's caption, "This tavern is a 5-minute walk away", says so. The Listing Grounding Validator (Grounding Validator below) has a VLM (a large model that reads images and text together) read the photo, the caption and the listing description together. The VLM answers three questions: Is this the listing? Is it consistent with the listing's facts? Does it faithfully show the amenities and conditions the guest will find?
When the cabin's tavern photo reaches this step, input and output look roughly like this (illustrative):
Input   Photo: the front of a small tavern
        Caption: This tavern is a 5-minute walk away
        Listing description: lakeside cabin, two bedrooms, backyard pool...
Output  Verdict: not representative
        Reason: the caption says the tavern is a 5-minute walk away, so the photo does not show this listing
Photos that fail are dropped outright. The authors would rather reject more photos than let misleading ones through, so they benchmarked models on 1,000 expert-labeled photo-listing pairs and chose GPT-4o-mini for its strong recall (the share of problem photos that get caught); its macro F1 is 0.82.
What this gate does shows in what happens without it. The authors randomly sampled 1,000 candidates; removing the Grounding Validator and keeping only the vision classifier dropped recall on non-representative photos from 98% to 89%, and the number of such photos that slipped through grew 5.3 times. Illustration: if 100 of 1,000 candidates have problems, 98% recall misses 2 and 89% recall misses 11. A recall gap of only 9 percentage points thus lets several times more problem photos through. Most of the photos that slipped through showed places outside the listing, such as nearby attractions, exactly the tavern kind.
The CTR model learns which of two photos has the higher click rate
The CTR model is also a vision head on top of the embedding. Any photo with an embedding can be scored, so the 10 photos that were never covers get scores too.
The model does not predict absolute CTR directly; it learns which of two photos has the higher CTR. Both photos go through the same network (a Siamese structure), each gets a score, and the difference of the two scores goes through a sigmoid. My reading is that absolute CTR mixes in how good the listing itself is; if the two photos in a pair come from the same listing and the same surface, subtracting the scores cancels that part, and the model learns mainly the difference between photos. Illustration: the pool photo scores 1.0 and the sofa photo 0, , meaning the model puts the probability that the pool photo has the higher CTR at about 73%.
When predicting offline which of two home-page photos has the higher CTR, guessing by the host's choice is right 57% of the time and the CTR model 68%. Random guessing gives 50%, so the host's choice beats random guessing, and the CTR model gets more photo pairs right than the host's choice.
That 73% is only a win rate, and the Opportunistic source needs "CTR lift × traffic"; a win rate cannot be multiplied by traffic directly. The authors tried adding an MSE term (mean squared error, here measuring how far the prediction is from the real CTR) to the training loss for calibration; a weight of γ=0.42 gave the best trade-off between calibration and ranking, but calibration error remained for photos with very high or very low scores. The final approach fits a monotonically increasing function after training that maps the model's score for a single photo to a CTR, which reduced calibration error more than the MSE term. Because the function is monotonically increasing, a higher-scoring photo still has a higher CTR after mapping, so calibration does not change the order of photos. Hoot says

Isotonic: B and C flattened
- A: score 0.52, observed 2.90%
- 2.90%
- B: score 0.53, observed 3.10%
- 3.09%
- C: score 0.54, observed 3.08%
- 3.09%
- Mean error (points)
- 0.007
- Top candidate
- B and C tie
B and C's observed values run high then low, so the order constraint can only merge them into one segment at their mean, 3.09%.
Spline: B and C stay apart
- A: score 0.52, observed 2.90%
- 2.90%
- B: score 0.53, observed 3.10%
- 3.08%
- C: score 0.54, observed 3.08%
- 3.10%
- Mean error (points)
- 0.013
- Top candidate
- C
A monotone function keeps the order of σ(z). What it preserves is the model's judgment, which can still be wrong: here B's observed value is actually higher.
All numbers are illustrative: A, B and C are three candidates with 5000 impressions each. Label: the ELM logs impressions and clicks, giving each photo a CTR. A gets 145 clicks (2.90%) and C gets 154 (3.08%), so this pair's label is "C is higher". Training: both branches share one head. A gets z=0.08 and C gets z=0.16, so the model outputs the probability that A beats C, σ(0.08−0.16)=0.48, a number that only means something for this pair. Inference: no pairing is needed; each photo goes through one branch for its z, and A's single-photo score is σ(0.08)=0.52. Calibration: a monotone function maps σ(z) to CTR, and candidates are ranked by the calibrated CTR. The columns above compare only this last step, on identical inputs.
Source
paper §4.3.2 (Siamese pairwise training), §4.3.3 (isotonic vs. spline), Algorithm 1 (p=σ(z_l−z_r), label 1[CTR_l>CTR_r], monotone spline from σ(z_i) to CTR_i), §4.6 (ranking by calibrated CTR), §4.7.1 (exploration logs converted to photo pairs); the deployed model was trained only on HomePage data. Scores, clicks and calibrated outputs are illustrative.Common choices for the monotone function are isotonic regression and splines; the two gave nearly the same calibration error, and the authors chose splines because of how the scores are distributed. Many photos have very close predicted CTRs, and isotonic regression tends to squash neighboring scores into the same value. Illustration: three photos have scores of 0.70, 0.71 and 0.72 before mapping; isotonic regression might map all of them to 2.0%, a three-way tie, while a spline can give 1.98%, 2.00% and 2.02%, keeping the order.
When a guest ticks "pool", only pool photos are eligible
After the previous steps, the tavern is out, and the remaining candidates have calibrated CTRs and content labels. Every day the system computes a list like this for the cabin (illustrative):
| Context | Eligible candidates (calibrated predicted CTR) | Mainly shown |
|---|---|---|
| Home page, no filter | Bedroom 2.4%, pool 2.2%, sofa 2.0% | Bedroom |
| Search page, "pool" ticked | Pool 2.2%, pool at night 1.9% | Pool |
The model scores are the same in both rows; what changes is that the second row keeps only photos with the pool label. If the search page ignored search conditions, a guest who ticked "pool" would mainly see the bedroom: that photo has the highest predicted click rate but does not answer the guest's question. The difference in the filter-based experiment lies exactly in this second row.
Why keep 10% random exploration online instead of Thompson Sampling
The CTR model needs training data from fair comparisons; otherwise it is back to the opening problem that the sofa's high clicks may have nothing to do with the photo. The online ELM (Exploration Logging Module, which picks photos at random and logs the results) provides these comparisons. It uses ε-greedy with ε=0.1. Illustration: in one context the cabin has k=4 candidates; of 1,000 impressions, 900 go to the model's top photo and the other 100 are spread uniformly at random over the 4, about 25 each.
Those 100 impressions are not affected by the model's scores, so new photos get a chance to be compared at random with old ones within the same traffic. One training sample built from the logs looks roughly like this (illustrative): left photo pool, right photo sofa, page home, pool CTR 2.5%, sofa CTR 2.0%, label left wins.
Thompson Sampling keeps a Beta distribution for each photo, updates it with the previous day's impressions and clicks, and samples from the distributions to decide which photo to show, so photos with good clicks get drawn more often; it sounds more economical than a fixed 10% of random traffic. Its difficulty is that each photo gets too few impressions. Illustration: a new photo with 20 impressions and 1 click has an observed CTR of 5%, and one more click makes it 10%, so gaps of a few tenths of a percentage point between photos cannot be told apart in such noise.
The authors ran an 18-day comparison on the home page. Thompson Sampling was first initialized with 8 weeks of online traffic, and its opponent was a policy that picks the photo with the highest calibrated predicted CTR each day (CTR Exploit in the figure). The regret gap in Figure 5 is the CTR difference between the photos the two policies choose, and a positive value means CTR Exploit chose better.
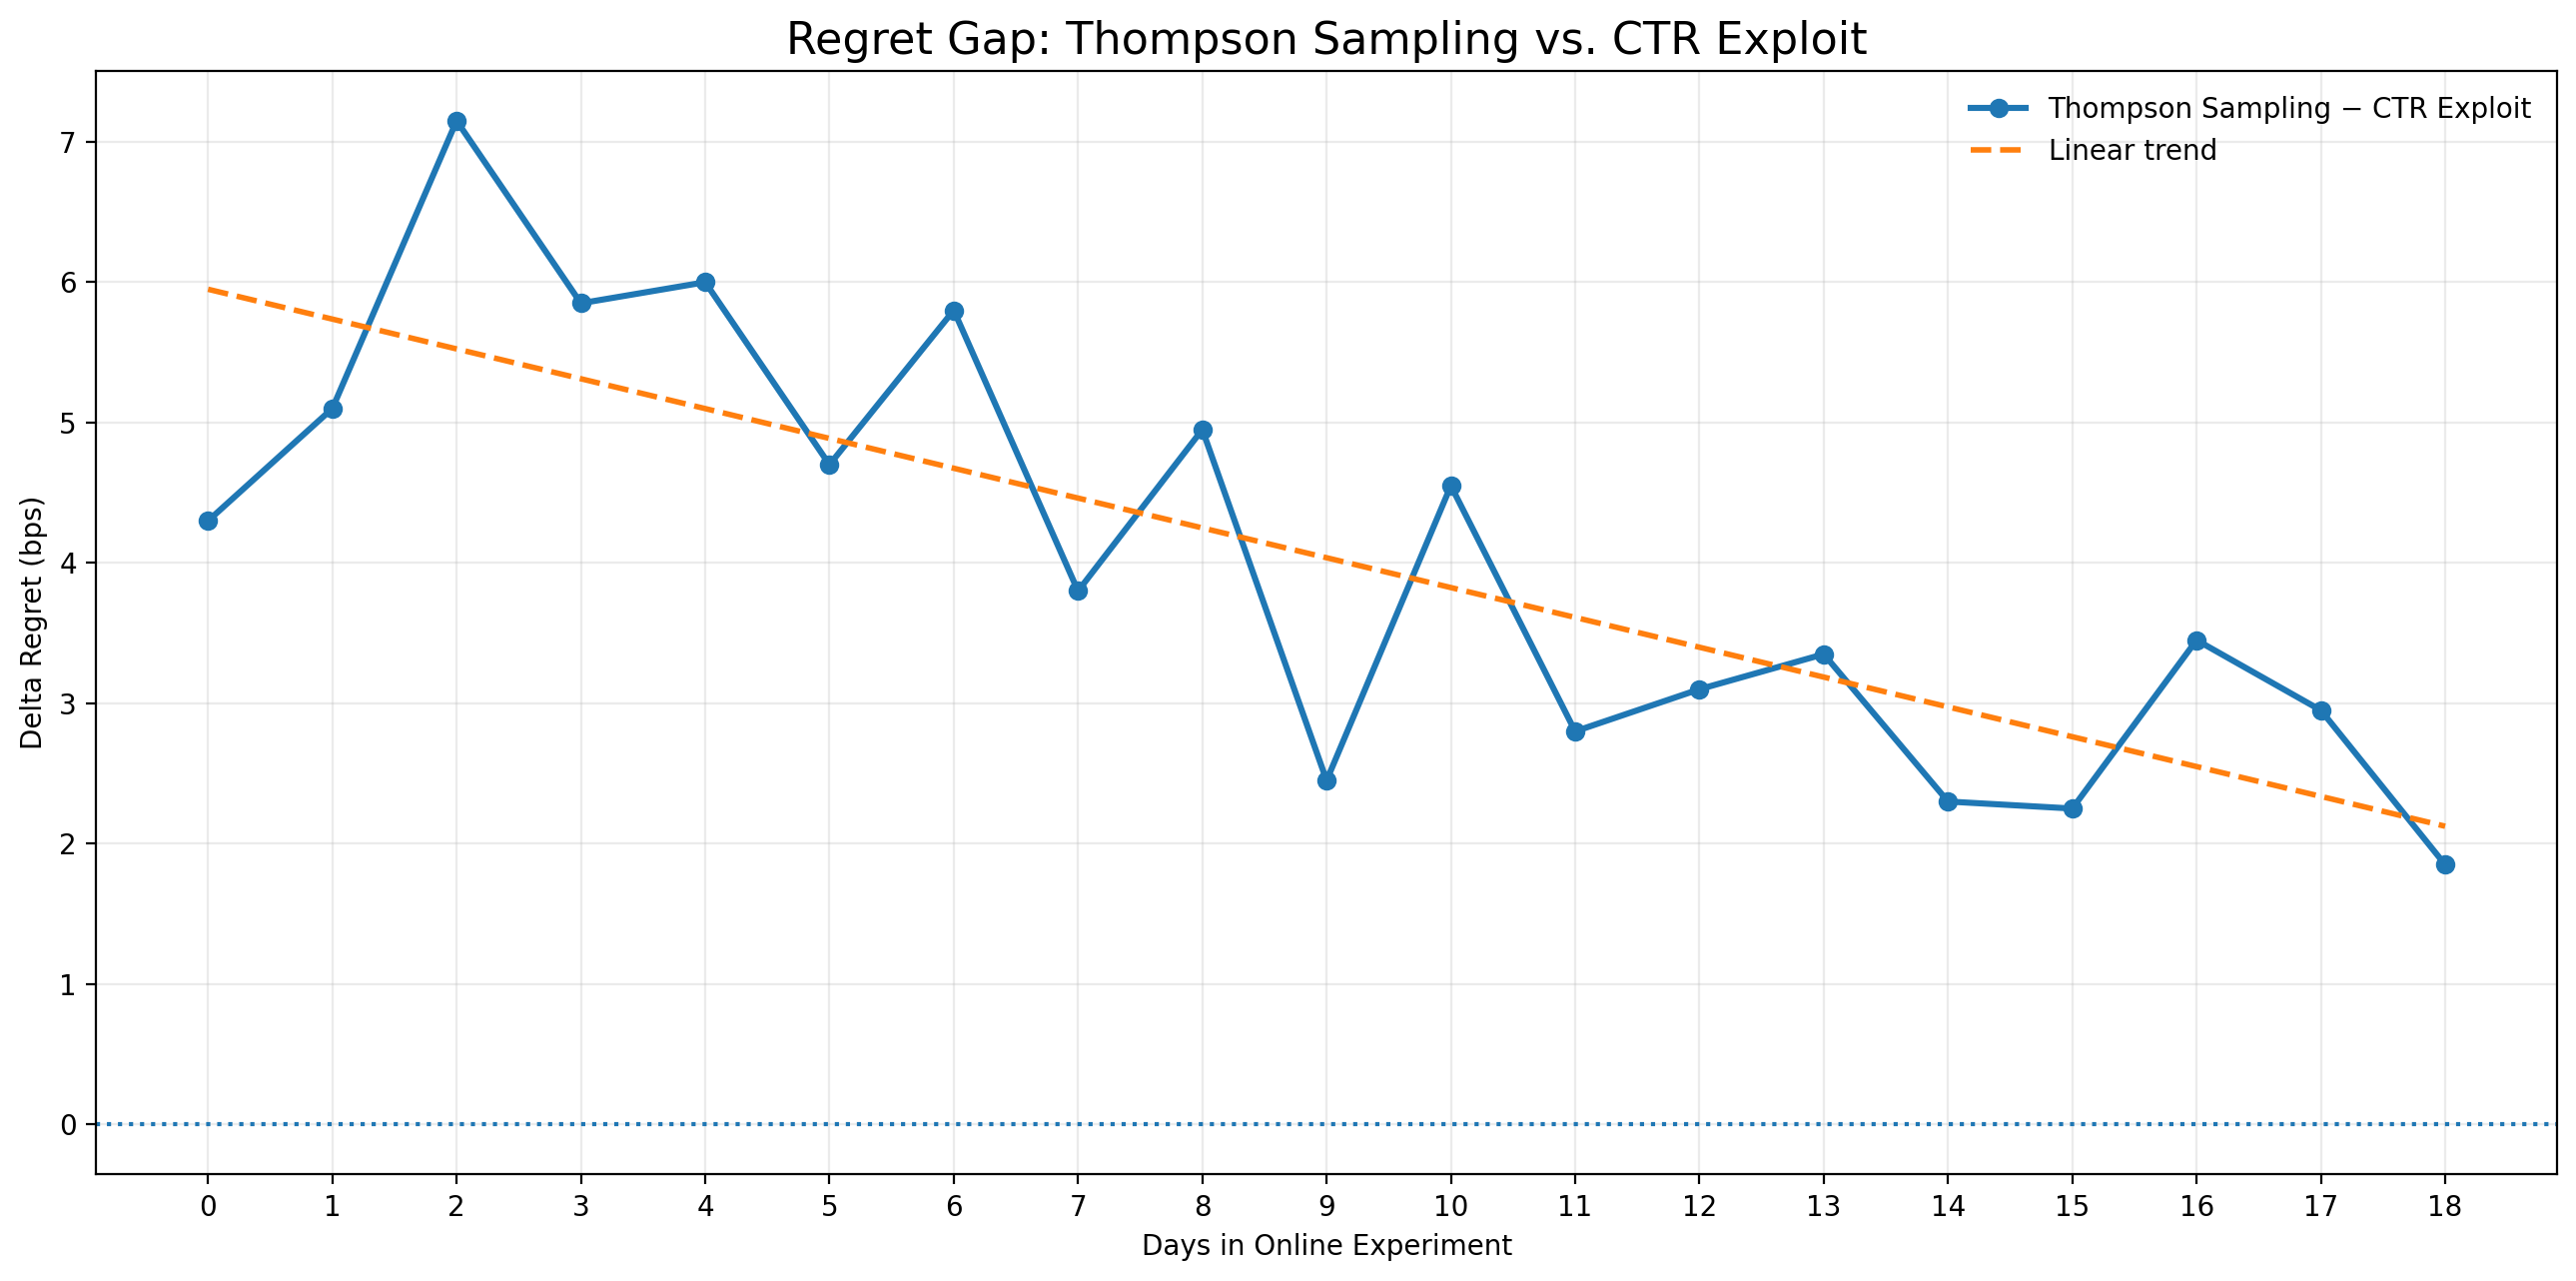
The gap stayed positive throughout and shrank by about half over the 18 days; Thompson Sampling did not catch up within the experiment window. When impressions are sparse, the offline-trained CTR model picks photos with higher click rates than an online policy that learns while trying; the shrinking gap also shows that the online policy does improve as data accumulates.
Two things OptiCover does not do yet
OptiCover currently swaps photos by filter, so guests who tick the same filter mainly see the same photo; it does not yet swap by individual guest preference. It also cannot change the order of listing cards in search results: after the cabin switches to the pool photo, its position is still decided by the existing ranking. The authors list both as next steps: adding guest-level preferences, and ranking listings and photos jointly.
Back to the cabin from the start: in the filter-based experiment that raised bookings, what OptiCover does is concrete. It first blocks the tavern, then puts the pool photo on the cover when a guest ticks "pool". The click-rate model's job is ordering the few photos that remain.
How did this read for you?
Hoot made a note. Thanks for the feedback.

One tap, no sign-in; tap again to undo. Only anonymous counts are kept, never who you are.
Related papersMore from Paper Daily
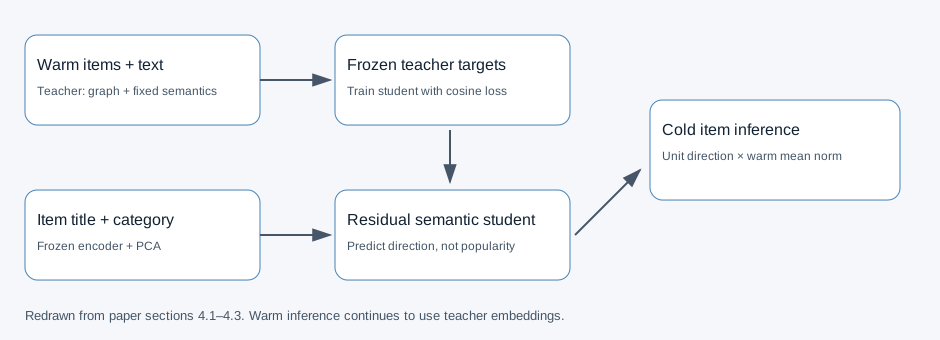 Personalization · 2026-10-16Bridging the Topological Divide: Dual-Branch Graph Distillation with Semantic Priors for Robust Cold-Start RecommendationDualGCN gives interaction-free items a representation through semantic-anchored graph distillation. A separate student learns directions, while inference restores vector magnitude. On Sports cold items, Recall@20 exceeds DropoutNet by 20.8%.
 Personalization · 2026-09-01Personalized and Multi-View Representation for Federated Cold-Start RecommendationDeep dive: Personalized and Multi-View Representation for Federated Cold-Start Recommendation.
 Personalization · 2026-11-12INTENT: Out-of-Sample, Out-of-Time, and Cold-Start Evaluation on User Event SequencesOnce deployed, sequence models in banking and recommendation face a period after the training cutoff, users never seen in training, and newly appearing items, yet the usual evaluation just holds out each user's last few events. INTENT splits the test into seven cells by whether each of these three was seen in training, and picks the cutoff date on five public datasets with one rule fixed in advan…
Discussion
Add experiment details, reproduction notes or a different take. Requires a GitHub sign-in.
Loading the discussion…