Contents · 7 sections
1Three yes/no questions put each test event into one cell2A cell needs at least 1,000 users before it ranks models3Of 59 public dataset families, 19 lack a calendar time that orders events4The five datasets share no date, so they share a splitting rule instead5Which cell you look at decides which model is best6Measuring with repeat-last: whose fault is the score lost over time7Back to the coffee shop in JulySHARE

INTENT (a public benchmark released by the authors) splits the test of a user event sequence model into seven cells, and adds a control that learns no parameters at all: repeat the user's last item. From that control, the authors conclude that on three datasets most of the score lost after the training cutoff comes from changed user behavior, not only from the model.
Banks and payment networks now train foundation models on sequences of customer events: card transactions, app sessions, and authorizations. The model reads one customer's events in time order and predicts what that customer does next, for example which merchant the next transaction lands at.
The hard part is that a deployed model always predicts forward in time. Here is the example used throughout (illustrative): a bank trains its model on transactions up to June 30. In July, a newly onboarded customer, Zhou, pays at a coffee shop that opened in July. That one transaction hits three things the model has never seen at once: a new customer, a period after training, and a new merchant. Yet each bank evaluates on its own private data with its own metrics, so no outsider can compare which of two models handles this better.
Public sequential recommendation benchmarks could fill the gap, but the way they split data never tests the future. 77% of recent sequential recommendation papers hold out each user's last few events as the test. Put that back into the example: existing customer Wang last paid on June 10, and that payment is held out for testing. Meanwhile all of Li's July transactions go into training, including Li's visits to the new coffee shop. So before the model is tested on Wang, it has already seen July through Li, and its score can be inflated. Worse, a case like Zhou's, a new customer at a new merchant, is buried in the overall average and cannot be pulled out on its own.
Three yes/no questions put each test event into one cell
INTENT asks three yes/no questions about every test event. Did this user appear in training? Did the event happen before or after the cutoff date? Did the target item appear in training? In a bank, the user is the customer, and the item can be the merchant of the next transaction. New items arise mainly at the merchant level, because merchants open all the time while transaction category codes rarely change.
The user question comes from a holdout: the authors pick 10% of users at random and keep them out of training entirely. The time question comes from the cutoff date: events before it can be trained on, events after it are only tested. The item question is answered at test time.
Three binary questions should give eight cells, but INTENT has seven. The known-user, before-cutoff cell tests the training events themselves, so every target item is seen and there are no new items to split off. The table below places the example's transactions in their cells (illustrative):
| Illustrative transaction | User | Time | Target item | Cell |
|---|---|---|---|---|
| Wang pays at the usual supermarket in May | known | before cutoff | seen (not split) | known user, before cutoff |
| Wang pays at the usual supermarket in July | known | after cutoff | seen | known user, after cutoff, seen item |
| Wang pays at the new coffee shop in July | known | after cutoff | new | known user, after cutoff, new item |
| Held-out user Chen pays at a supermarket in May | new | before cutoff | seen | new user, before cutoff, seen item |
| New customer Zhou pays at the new coffee shop in July | new | after cutoff | new | new user, after cutoff, new item |
The two cells not listed are new user, before cutoff, new item and new user, after cutoff, seen item. Each row is the label INTENT attaches to one test event, and scores are aggregated per cell instead of being folded into one overall average.
The known-user, after-cutoff cell is closest to the common practice of holding out each user's last event. The difference is that no training event comes after any test event, so Li's July transactions can no longer leak into training.
For scoring, the model ranks every item in the dataset with no sampled negatives, because sampled negatives can by themselves reverse the order of models. The main metric is NDCG@10, computed per user and then averaged over users.
A cell needs at least 1,000 users before it ranks models
Once the cells are fine-grained, some may hold too few people. INTENT requires at least 1,000 distinct users in a cell before that cell is used to rank models. The unit is the user rather than the event, because one person's repeated card payments are correlated and do not count as independent evidence.
The 1,000 figure can be checked in your head: take a per-user NDCG standard deviation of 0.3, divide by the square root of 1,000 (about 31.6) to get 0.0095, and multiply by 1.96 to get about 0.019. The authors state that with a per-user NDCG standard deviation of 0.2 to 0.3, 1,000 users give a 95% interval on the mean with a half-width of about 0.012 to 0.019. When ranking, a model counts as the leader of a cell only if its 95% interval overlaps no other model's.
Of 59 public dataset families, 19 lack a calendar time that orders events
INTENT only predicts the next item, so any dataset with users, items, and ordered events is a candidate. The authors examined 101 public releases and grouped variants of one source into a family (for example, all categories of Amazon Reviews count once), for 59 families.

A dataset has to pass five criteria, and the one that bites hardest is the calendar timestamp. An order number or a position within a session can order one user's own events, but cannot place two users on one timeline. A cutoff date needs exactly that shared timeline: Wang's payment on June 10 and Li's payment on July 2 must be clearly on one side of the cutoff or the other.
This criterion also excludes the largest public bank dataset, with 950M transactions from over 2M corporate clients. For anonymization, the release adds random noise to dates, and its own authors note this may reorder a client's events.
Each of the five datasets that remain adds one condition no other provides:
| Dataset | Condition it adds | Cutoff | Test-period days | Events |
|---|---|---|---|---|
| Amazon H&K | sparse long tail, 25 years | 2022-09 | 377 | 67.4M |
| KuaiRand | 8 action types, random exposure | 2022-05-06 | 2 | 323.5M |
| MicroLens | video with image, text, audio | 2022-09 | 11 | 9.1M |
| H&M | customer profiles and price | 2020-07 | 83 | 31.8M |
| REES46 | amount, view to cart to purchase | 2020-04 | 29 | 411.7M |
Two of them sit closest to banking. REES46 (a multi-category e-commerce log of views, cart additions, and purchases) carries a price and a purchase funnel on every event, which makes it the public data most like a transaction stream with amounts. H&M joins static customer attributes to purchase histories, the way a bank joins a customer profile to a ledger.
The five datasets share no date, so they share a splitting rule instead
The obvious idea is one cutoff date for all datasets, so every test covers the same calendar period. These five datasets do not allow it: H&M and REES46 end in 2020, and KuaiRand only begins in 2022.
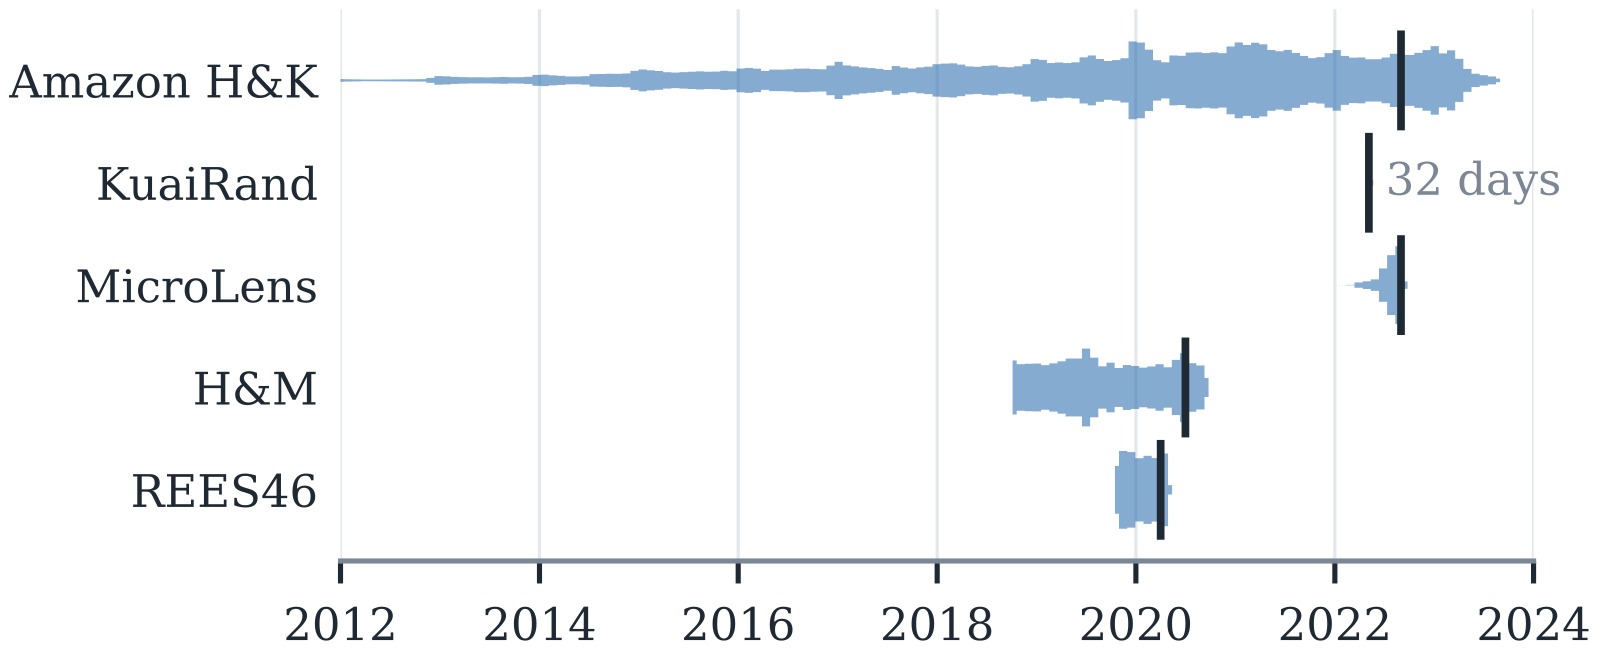
The authors scanned 9,238 daily boundaries from 1998 to 2023, and none leaves events on both sides for all five datasets. Take 2022-05-04, which both Amazon and KuaiRand cover: H&M and REES46 would have no future events to test, and MicroLens would have only 5% of its data in training.
So comparability rests on a shared rule instead, fixed before any model score is seen. The rule targets 80% of rows in training and admits 75% to 85%. The 10% held-out users never enter training, so about 89% of events must fall before the cutoff to reach 80% (rough check: 0.8 / 0.9 is about 0.89). Candidate cutoffs are month boundaries, or day boundaries for datasets spanning 62 days or fewer, and the cutoff is the midpoint of the admissible candidates.
Fixing the rule first prevents anyone from moving the cutoff date to make their own model look better. The price is very different test periods: 2 days on KuaiRand and 377 days on Amazon. A difference between two datasets may therefore come from test-period length rather than from the platform. INTENT reports with every result the cutoff date, the length of training histories, the share of users and items seen in training, and the test-period length.
After this split, summed over the five datasets, the smallest cell (new user, before cutoff, new item) holds 111,769 users and the largest (known user, before cutoff) holds 15.9M. Only H&M and MicroLens fall below 1,000 in that smallest cell, and their results there are reported with intervals but not used for ranking.
Which cell you look at decides which model is best
The authors include four reference models, with all hyperparameters set before any test score is computed:
- Popularity: mixes the user's own item counts (weight 0.7) with a smoothed global item distribution.
- repeat-last: ranks the user's previous item first and ties every other item below it; it learns no parameters.
- SASRec: a causal transformer with 2 blocks, 64 dimensions, and a context of the last 50 events; it can only score items seen in training.
- SASRec-F: each item vector is the sum of two parts: the mean embedding of its metadata tokens (words from the title, category, and brand), plus an ID embedding that only items seen in training have. Training drops the ID embedding with probability 0.5, so the model learns to rank from metadata alone; at evaluation the ID embedding is multiplied by 0.5, its expected value in training. A new item has no ID and is scored from its metadata tokens only.
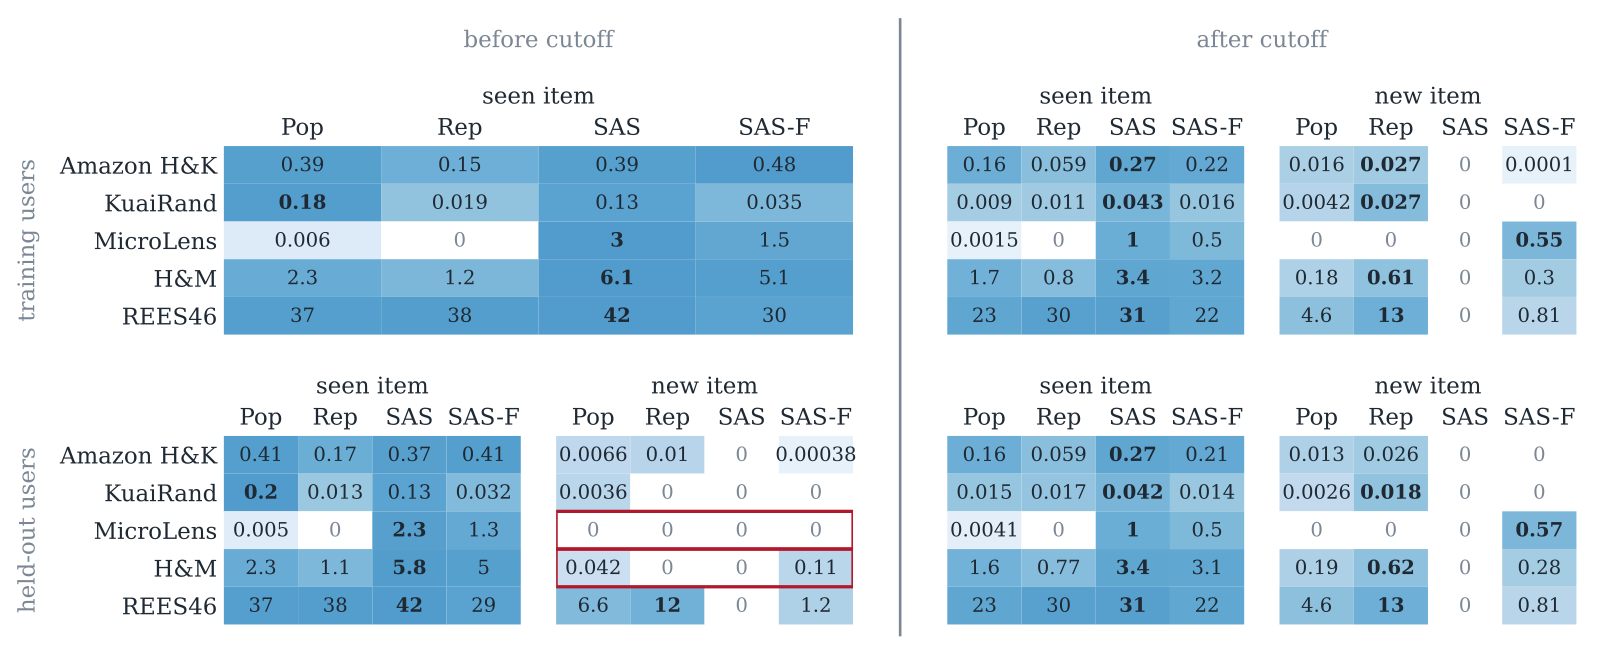
In the known-user, after-cutoff, seen-item cell, SASRec leads on every dataset, and on H&M it doubles Popularity (3.4 against 1.7). When the same users choose new items, SASRec scores exactly zero, because it has no vector for a new item. There repeat-last leads on four of the five datasets; the exception is MicroLens, where only SASRec-F scores above zero. New users after the cutoff show the same reversal. Hoot says

Illustrative: every embedding is shrunk to one number, and the item and token values are made up; the 0.5 drop probability and evaluation scaling come from the paper. Metadata tokens are drawn from the titles, categories and brands of training items.
Source
paper §5 SASRec-F: item vector = mean of metadata-token embeddings + ID embedding for a training item; training drops the ID with probability 0.5; at evaluation the ID is scaled by 0.5; a new item is scored from its tokensThis shows that a single overall score mixes two abilities: SASRec is good at remembering seen items and helpless on new ones. For Zhou's new coffee shop, SASRec's score is zero.
Measuring with repeat-last: whose fault is the score lost over time
First, compare the cost of a new user with the cost of time. After the cutoff, SASRec's score on new users is within 4% of its score on known users on every dataset, and none of the four models differs significantly between the new-user and known-user cells. The reason is simple: none of the four models has parameters specific to a user, so a new user's history serves as well as a known user's. The authors acknowledge that this leaves the user axis untested.
Crossing the cutoff is different. Measured on new users (so both periods are out of sample), SASRec loses 25% to 68% of its score on seen items.
Where does that score go? This is where the authors bring in repeat-last. It learns no parameters and cannot overfit the training period, yet it still loses 21% to 64% across the cutoff on Amazon, H&M, and REES46. From this the authors conclude that behavior after the cutoff is itself harder to predict from history, and they count a model's loss beyond repeat-last's as the model's own. This accounting has a premise: repeat-last's loss stands for the effect of behavior change on every model.
A small illustrative calculation: repeat-last scores 0.10 before the cutoff and 0.05 after, keeping 50%; some model scores 0.30 before and 0.15 after, also keeping 50%. That model lost half its score, but by the authors' accounting it lost nothing beyond repeat-last, and the whole loss goes to behavior change.
The real numbers show both cases. On Amazon SASRec keeps 73% while repeat-last keeps only 36%, so SASRec loses much less than the control. On H&M SASRec keeps 59% while repeat-last keeps 71%, so SASRec loses an extra slice, which by the authors' accounting belongs to the model. KuaiRand is a third case: Popularity keeps only 8% while repeat-last does not change significantly. The authors read this as the videos popular in training no longer being the ones watched after the cutoff.
The claim that most of the loss comes from behavior change covers only Amazon, H&M, and REES46, and it relies on the premise above. With test periods ranging from 2 to 377 days, test-period length is also tangled up with platform differences.
Back to the coffee shop in July
Zhou's payment at the new coffee shop falls in the new user, after cutoff, new item cell. A model that knows items only by ID scores zero there. repeat-last cannot help with a first visit either: it only recovers new items the user already touched earlier in the test period, so it still loses 20% to 57% on new items on Amazon, H&M, and REES46. A user's first choice of a new item cannot be guessed from history alone.
How much metadata helps depends on how rich the item descriptions are. For known users after the cutoff, SASRec-F's score on new items is 112% of its seen-item score on MicroLens, 10% on H&M, and 4% on REES46. It is near zero on Amazon and zero on KuaiRand, where coarse metadata ties new videos in large groups. The price is that SASRec-F scores 7% to 66% below SASRec on seen items.
The authors' advice to banks carries straight over to their own ledgers: fix the cutoff rule in advance, hold out some customers, count the users in every cell, and add a training-free control such as repeat-last. The authors argue that, as long as its loss stands for the effect of behavior change, it separates customer behavior drifting from a model failing to keep up.
These reference models are untuned and serve only as a lower reference for each cell, and none of the five datasets comes from a bank, since the public bank data available was excluded for noisy dates. INTENT provides a measuring tool; the numbers still have to come from a bank's own data.
How did this read for you?
Hoot made a note. Thanks for the feedback.

One tap, no sign-in; tap again to undo. Only anonymous counts are kept, never who you are.
Related papersMore from Paper Daily
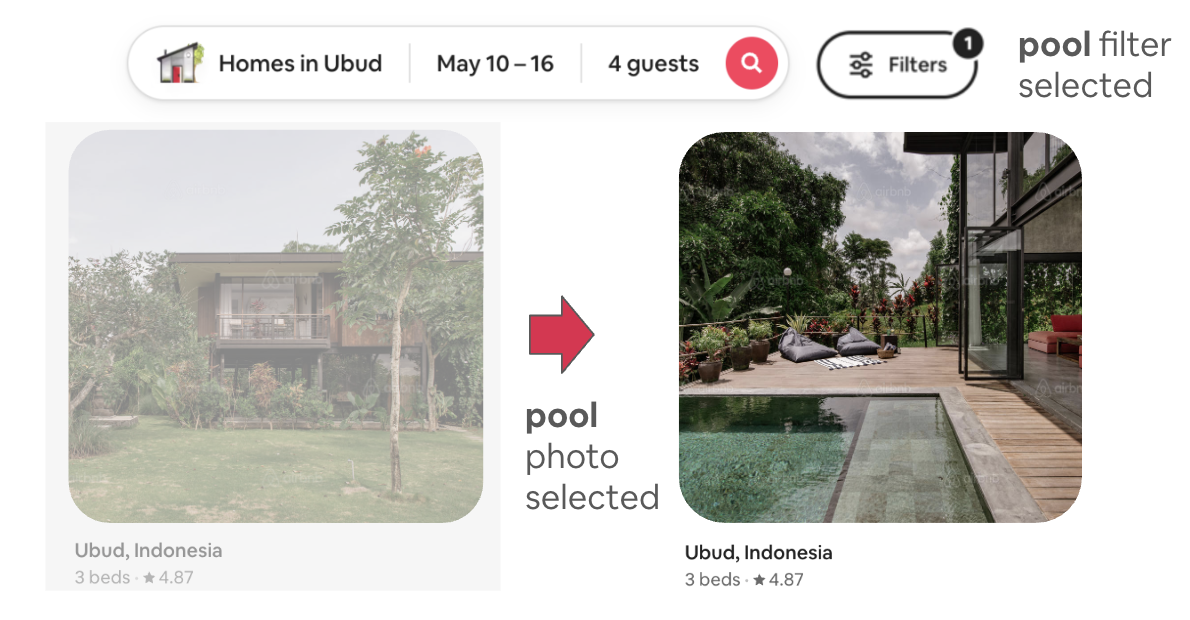 Personalization · 2026-11-11OptiCover: A Scalable and Multi-Surface Framework for Cold-Start Visual Optimization under Semantic ConstraintsAirbnb wants to choose cover photos for hosts, and there are two difficulties. Over 90% of listing photos have never been a cover and so have no click data to learn from, and the most clickable photo may show a nearby attraction that does not represent the listing. The authors first screen candidates with indirect cues, use a VLM to check photos against the listing description, and then pick by p…
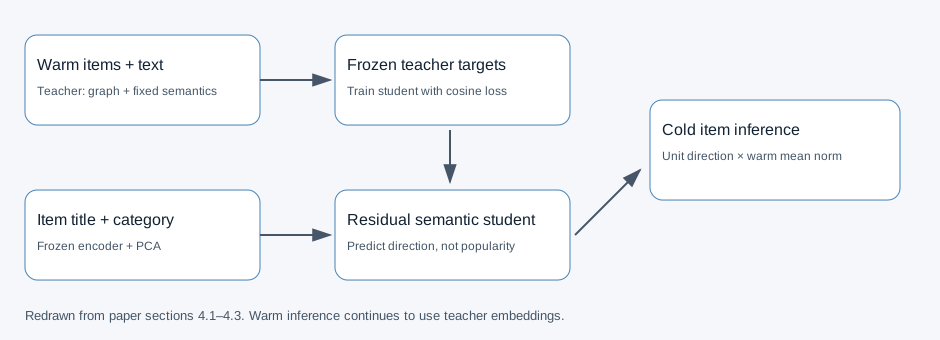 Personalization · 2026-10-16Bridging the Topological Divide: Dual-Branch Graph Distillation with Semantic Priors for Robust Cold-Start RecommendationDualGCN gives interaction-free items a representation through semantic-anchored graph distillation. A separate student learns directions, while inference restores vector magnitude. On Sports cold items, Recall@20 exceeds DropoutNet by 20.8%.
 Personalization · 2026-09-01Personalized and Multi-View Representation for Federated Cold-Start RecommendationDeep dive: Personalized and Multi-View Representation for Federated Cold-Start Recommendation.
 Personalization · 2026-11-03BrowseFlow: Sparse Event Flow Matching for Generative User SimulationShown the same feed, the same user might scroll to item 20 and click two things this time, and leave at item 8 the next; the log keeps only one of these. BrowseFlow argues that a user simulator should learn the distribution of such outcomes rather than copy that one log. It splits a browsing session into two things, how deep the user scrolls and at which positions they click or like, and generate…
 Personalization · 2026-10-25PAIR: Preference-Aligned Intent Retrieval for Premium People Recommendation at LinkedInOn LinkedIn, a software engineer who starts looking for a job usually wants to open the profiles of recruiters, hiring managers and HR, not other engineers. In professional networking, who should be recommended is often complementary, not similar. Yet most recommender systems assume that the more alike two profiles are, the more one should be recommended, so they keep showing him his peers. PAIR…
Discussion
Add experiment details, reproduction notes or a different take. Requires a GitHub sign-in.
Loading the discussion…