Contents · 7 sections
1What goes wrong when the partner changes2The change is one line of loss3Walking through it: one impression without a click4Results5Does it still work with negative downsampling?6What this means for people building conversion models7LimitationsSHARE

Trained with one click-rate model, served with another: aligning ESMM's conversion score with its serving partnerTo rank an ad near the top, a system often looks at the probability of "clicked and then bought", called pCTCVR. It is the product of two numbers: will the user click (pCTR), and having clicked, will they buy (pCVR).
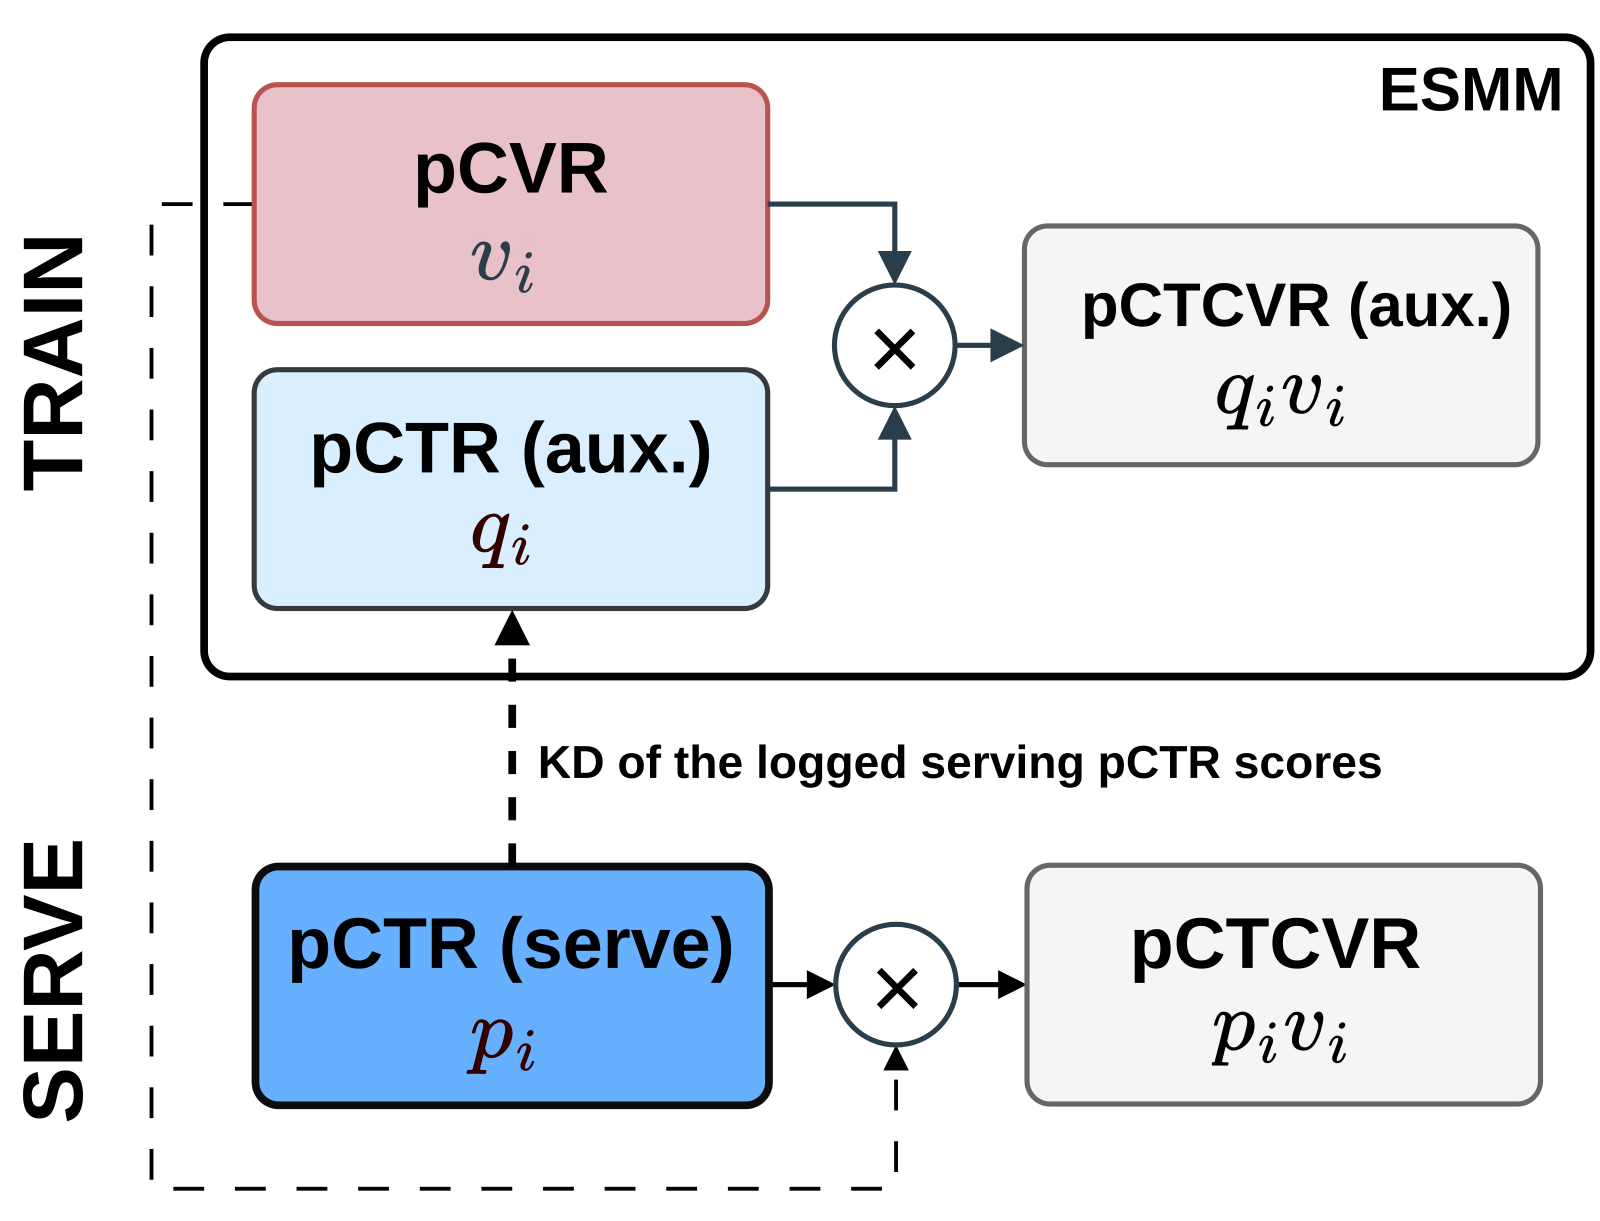
Many pCVR models build on ESMM. ESMM has two towers: one predicts pCVR, written v; the other is an auxiliary pCTR tower, written q. Training fits "clicked and bought" with q × v. At serving time, though, the auxiliary tower is dropped and v is multiplied by a separately trained production pCTR model, whose score we write p. In training v's partner is q; in serving it is p.
This short paper from Reddit and Arizona State University deals with that change of partner. The production pCTR model may be large and expensive to train, and may be shared by several ranking stages, so retraining it jointly with pCVR is costly and hard to operate. Another option is to drop the auxiliary tower and train directly on p × v (the paper calls this Direct). The authors do something smaller: keep the serving pCTR model frozen, use its logged scores p as a teacher, and distill them into ESMM's auxiliary tower so that q in training sits close to p in serving. On Ali-CCP, the best setting raises the AUC of the served p × v by 2.1% and its PR-AUC by 9.9% relative to ESMM; pCVR's own AUC and PR-AUC also rise by 1.6% and 8.8%.
Teaching the auxiliary pCTR tower to follow the serving pCTR scores makes ESMM's pCVR more accurate where it is served; the evidence comes only from offline experiments on one public dataset.
What goes wrong when the partner changes
ESMM's loss has two terms. One fits the auxiliary tower's q to "clicked or not"; the other fits q × v to "clicked and bought or not". The second term ties v to q: how large v becomes is learned with q as its partner.
At serving time v's partner becomes p. If p and q differ a lot on some impression, p × v no longer matches the q × v that training fitted. q and p come from two independently trained models; their overall AUC can be similar while their scores on a single impression differ widely.
The change is one line of loss
The original auxiliary click loss is BCE(clicked, q). The paper replaces it with a weighted pair: α × BCE(clicked, q) + (1 − α) × BCE(p, q). The second term is knowledge distillation, using the serving model's score p as a soft label. α = 1 recovers ESMM; α = 0 listens only to the teacher. The paper writes KD–α for each weight, so KD–0.3 means α = 0.3.
The q × v term is unchanged, and so is the architecture. p is only a supervision signal: it is not a model input and receives no gradient. The serving pCTR model needs no code change.
Walking through it: one impression without a click
The numbers below are illustrative; the formulas come from Section 3 of the paper.
Step 1, the label and the teacher. The user did not click, so clicked = 0. The serving pCTR model gave this impression p = 0.04.
Step 2, where the auxiliary tower is pulled. Plain ESMM has only the hard label, which pulls q toward 0 on this impression. KD–0.3's two BCE terms together act like training on a mixed label: 0.3 × 0 + 0.7 × 0.04 = 0.028, so this impression pulls q toward 0.028, close to p.
Step 3, how v learns. Suppose the true "clicked and bought" probability for this kind of impression is 0.002, and compare two auxiliary towers: one far from the teacher, with q at 0.02, and one close to it, with q at 0.04. Both fit q × v to 0.002, so the first learns v = 0.1 and the second v = 0.05.
Step 4, serving. v is now multiplied by p = 0.04. The version with q = 0.02 serves 0.04 × 0.1 = 0.004, twice the true 0.002, because v was learned with a partner that was too small. The version with q = 0.04 serves 0.04 × 0.05 = 0.002, exactly right.
So the closer q is to p, the less the served score drifts from the value training fitted. What must match is the score on each impression; a higher AUC for the auxiliary tower on its own does not guarantee that.
Results
Experiments use Ali-CCP, with 38.07M training, 4.23M validation and 43.02M test impressions. The authors first train a DCN-V2 as the "serving pCTR model" and use its scores as the logged p. Each model runs 10 random seeds. There are three baselines: plain ESMM; ESMM+DCN-V2, which replaces the auxiliary tower with a DCN-V2 of the same structure as the teacher; and Direct, which drops the auxiliary tower and trains p × v.
| Model | Auxiliary pCTR AUC | Served p × v AUC | pCVR AUC |
|---|---|---|---|
| ESMM | 0.6259 | 0.6599 | 0.6949 |
| ESMM+DCN-V2 | 0.6299 | 0.6679 | 0.7027 |
| Direct | no auxiliary tower | 0.6658 | 0.6973 |
| KD–0.3 | 0.6301 | 0.6736 | 0.7063 |
(Numbers from the paper's Tables 1 and 2; the teacher's own pCTR AUC is 0.6310)
The first column shows that the auxiliary towers of ESMM+DCN-V2 and KD–0.3 rank clicks almost equally well (0.6299 and 0.6301). The second column shows the served score is still better with KD–0.3. The difference is that KD–0.3 learned the teacher's score on each impression.
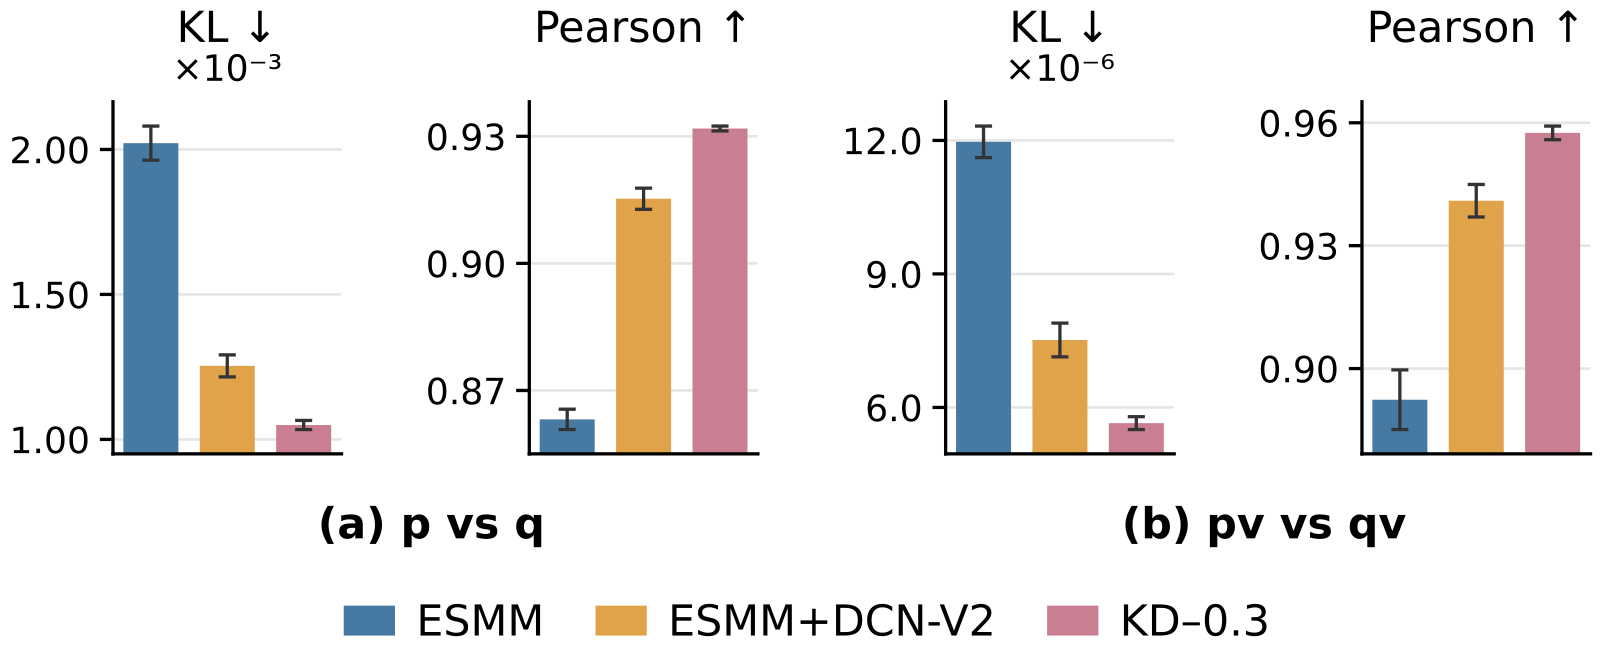
Figure 2 measures this. Compared with ESMM+DCN-V2, KD–0.3 lowers the KL divergence between q and p by 16.3% and between q × v and p × v by 24.9%, and both correlations rise.
More teacher weight gives a better served score. As α goes from 0.7 to 0.3, the served AUC rises from 0.6635 to 0.6736; KD–0, which listens only to the teacher, reaches 0.6732, just below KD–0.3. This suggests the gain comes mainly from the teacher term.
pCVR's own metrics also improve: relative to ESMM, AUC is 1.6% higher and PR-AUC 8.8% higher. The pCVR loss is unchanged; the authors read this as v learning better once the auxiliary tower is aligned. The paper reports the result but does not isolate the cause.
Against the stronger baseline the gain is smaller. Relative to ESMM+DCN-V2, the served AUC is 0.9% higher and PR-AUC 6.2% higher. The 95% confidence interval for the PR-AUC gain crosses 0, so it does not yet count as a stable improvement.
Does it still work with negative downsampling?
Production training often keeps only a small share of non-clicked impressions to save compute. The teacher's score then needs adjusting. p is a click probability over all impressions; after downsampling, clicks are more common in the retained samples, so the click probability of the same impression should change too.
The paper's correction is: corrected teacher score = p ÷ (p + β × (1 − p)), where β is the share of non-clicks kept. At evaluation the auxiliary tower's output is mapped back to the full-population scale. The correction is exact only when the teacher is well calibrated.
Keeping 5% of non-clicks, corrected KD–0.3 beats equally downsampled ESMM by 1.2% in served AUC and 0.9% in pCVR AUC, and by 8.5% and 4.5% in PR-AUC. This shows the gains survive common downsampled training, just smaller than with full data.
What this means for people building conversion models
If your pCVR is trained with ESMM but served multiplied by a different pCTR, first check how far training's q is from serving's p.
If your logs record the serving pCTR score for each training impression, you can add it as a soft label to the auxiliary tower's click loss. It is a one-line change and the serving model stays untouched. Compare the KL and correlation between q and p offline first, then see whether the AUC of p × v follows. With downsampled training, correct the teacher score by the retention rate first, otherwise the teacher and the samples disagree on the click rate.
α does not need fine tuning. In the paper 0.3 is best and teacher-only 0 is nearly the same.
Limitations
The "serving pCTR model" in the paper is a DCN-V2 the authors trained on Ali-CCP, not a real production system, and there is no online A/B test.
Only plain ESMM and one dataset are tested; whether it works on more complex ESMM variants is left for future work. Why pCVR also improves is shown only as a result plus a conjecture.
How did this read for you?
Hoot made a note. Thanks for the feedback.

One tap, no sign-in; tap again to undo. Only anonymous counts are kept, never who you are.
Related papersMore from Paper Daily
 Personalization · 2026-10-30Multi-Branch Cooperation Networks for Enhanced Click-Through Rate Prediction in Large-Scale E-Commerce SearchRanking teams should read this one, because it points out an often overlooked waste in multi-branch models: the branches are good at different samples, yet never learn from each other in training. The Pailitao team at Taobao (search by photo) makes three branches correct each other during training. On a given sample, if one branch gets the click right and another gets it wrong, the right branch's…
 Personalization · 2026-10-27iFusion: Integrating Dynamic Interest Streams via Diffusion Model for Click-Through Rate PredictionCTR models usually encode long-term and short-term behavior separately, then concatenate or gate them into one interest vector, so one-off noise in recent behavior, such as stocking up during a sale or buying for someone else, gets written straight into long-term preference. This JD.com ICLR 2026 paper treats long-term interest as a draft: it adds noise, then denoises step by step conditioned on…
 Personalization · 2026-10-24A Framework for Value-Aligned Modeling and Robust ExperimentationIn the Google Discover ads team's model iteration, offline and online results did not line up. The correlation between the change in the conversion model's offline loss and online advertiser value was only 0.1, and many changes that looked better offline failed in the small-traffic A/B stage. This paper weights the offline loss by how much each click is worth to the advertiser, so that a loss dec…
 Personalization · 2026-10-22ECHO: Efficient Cascade with Homogeneous Operators for Distillation-Guided 100K-Sequence ModelingECHO makes 100K-event histories affordable by retaining reusable original records before candidate-aware retrieval. A full-history teacher supervises selection, while retrieval and aggregation share relevance parameters. Kuaishou reports a 0.613% increase in app usage time in an online test.
 Personalization · 2026-10-27Hierarchical GTV Estimation: Bridging the Gap between Container-Level Ranking and Item-Level ConversionLocal-services and live-commerce ads are ranked and billed per store or livestream room, but users actually buy one voucher or one product inside it, so directly predicting how much a click will sell gives a noisy label that is hard to learn. This Meituan paper splits a store's expected sales into parts: first whether the user orders at all, then each voucher's purchase probability and quantity,…
Discussion
Add experiment details, reproduction notes or a different take. Requires a GitHub sign-in.
Loading the discussion…